Immigrants from Eritrea Married-Couple Family Poverty

COMPARE

Immigrants from Eritrea
Race
Ancestry
AfghanAfricanAlaska NativeAlaskan AthabascanAlbanianAleutAlsatianAmericanApacheArabArapahoArgentineanArmenianAssyrian/Chaldean/SyriacAustralianAustrianBahamianBangladeshiBarbadianBasqueBelgianBelizeanBermudanBhutaneseBlackfeetBolivianBrazilianBritishBritish West IndianBulgarianBurmeseCajunCambodianCanadianCape VerdeanCarpatho RusynCelticCentral AmericanCentral American IndianCherokeeCheyenneChickasawChileanChineseChippewaChoctawColombianColvilleComancheCosta RicanCreeCreekCroatianCrowCubanCypriotCzechCzechoslovakianDanishDelawareDominicanDutchDutch West IndianEastern EuropeanEcuadorianEgyptianEnglishEstonianEthiopianEuropeanFijianFilipinoFinnishFrenchFrench American IndianFrench CanadianGermanGerman RussianGhanaianGreekGuamanian/ChamorroGuatemalanGuyaneseHaitianHmongHonduranHopiHoumaHungarianIcelanderIndian (Asian)IndonesianInupiatIranianIraqiIrishIroquoisIsraeliItalianJamaicanJapaneseJordanianKenyanKiowaKoreanLaotianLatvianLebaneseLiberianLithuanianLumbeeLuxembourgerMacedonianMalaysianMalteseMarshalleseMenomineeMexicanMexican American IndianMongolianMoroccanNative HawaiianNavajoNepaleseNew ZealanderNicaraguanNigerianNorthern EuropeanNorwegianOkinawanOsageOttawaPaiutePakistaniPalestinianPanamanianParaguayanPennsylvania GermanPeruvianPimaPolishPortuguesePotawatomiPuebloPuerto RicanPuget Sound SalishRomanianRussianSalvadoranSamoanScandinavianScotch-IrishScottishSeminoleSenegaleseSerbianShoshoneSierra LeoneanSiouxSlavicSlovakSloveneSomaliSouth AfricanSouth AmericanSouth American IndianSoviet UnionSpaniardSpanishSpanish AmericanSpanish American IndianSri LankanSubsaharan AfricanSudaneseSwedishSwissSyrianTaiwaneseThaiTlingit-HaidaTohono O'OdhamTonganTrinidadian and TobagonianTsimshianTurkishU.S. Virgin IslanderUgandanUkrainianUruguayanUteVenezuelanVietnameseWelshWest IndianYakamaYaquiYugoslavianYumanYup'ikZimbabwean
Immigration
NonimmigrantsImmigrantsAfghanistanAfricaAlbaniaArgentinaArmeniaAsiaAustraliaAustriaBahamasBangladeshBarbadosBelarusBelgiumBelizeBoliviaBosnia and HerzegovinaBrazilBulgariaBurma/MyanmarCabo VerdeCambodiaCameroonCanadaCaribbeanCentral AmericaChileChinaColombiaCongoCosta RicaCroatiaCubaCzechoslovakiaDenmarkDominicaDominican RepublicEastern AfricaEastern AsiaEastern EuropeEcuadorEgyptEl SalvadorEnglandEritreaEthiopiaEuropeFijiFranceGermanyGhanaGreeceGrenadaGuatemalaGuyanaHaitiHondurasHong KongHungaryIndiaIndonesiaIranIraqIrelandIsraelItalyJamaicaJapanJordanKazakhstanKenyaKoreaKuwaitLaosLatin AmericaLatviaLebanonLiberiaLithuaniaMalaysiaMexicoMicronesiaMiddle AfricaMoldovaMoroccoNepalNetherlandsNicaraguaNigeriaNorth AmericaNorth MacedoniaNorthern AfricaNorthern EuropeNorwayOceaniaPakistanPanamaPeruPhilippinesPolandPortugalRomaniaRussiaSaudi ArabiaScotlandSenegalSerbiaSierra LeoneSingaporeSomaliaSouth AfricaSouth AmericaSouth Central AsiaSouth Eastern AsiaSouthern EuropeSpainSri LankaSt. Vincent and the GrenadinesSudanSwedenSwitzerlandSyriaTaiwanThailandTrinidad and TobagoTurkeyUgandaUkraineUruguayUzbekistanVenezuelaVietnamWest IndiesWestern AfricaWestern AsiaWestern EuropeYemenZaireZimbabweAzores
Select to Compare
Race
Ancestry
AfghanAfricanAlaska NativeAlaskan AthabascanAlbanianAleutAlsatianAmericanApacheArabArapahoArgentineanArmenianAssyrian/Chaldean/SyriacAustralianAustrianBahamianBangladeshiBarbadianBasqueBelgianBelizeanBermudanBhutaneseBlackfeetBolivianBrazilianBritishBritish West IndianBulgarianBurmeseCajunCambodianCanadianCape VerdeanCarpatho RusynCelticCentral AmericanCentral American IndianCherokeeCheyenneChickasawChileanChineseChippewaChoctawColombianColvilleComancheCosta RicanCreeCreekCroatianCrowCubanCypriotCzechCzechoslovakianDanishDelawareDominicanDutchDutch West IndianEastern EuropeanEcuadorianEgyptianEnglishEstonianEthiopianEuropeanFijianFilipinoFinnishFrenchFrench American IndianFrench CanadianGermanGerman RussianGhanaianGreekGuamanian/ChamorroGuatemalanGuyaneseHaitianHmongHonduranHopiHoumaHungarianIcelanderIndian (Asian)IndonesianInupiatIranianIraqiIrishIroquoisIsraeliItalianJamaicanJapaneseJordanianKenyanKiowaKoreanLaotianLatvianLebaneseLiberianLithuanianLumbeeLuxembourgerMacedonianMalaysianMalteseMarshalleseMenomineeMexicanMexican American IndianMongolianMoroccanNative HawaiianNavajoNepaleseNew ZealanderNicaraguanNigerianNorthern EuropeanNorwegianOkinawanOsageOttawaPaiutePakistaniPalestinianPanamanianParaguayanPennsylvania GermanPeruvianPimaPolishPortuguesePotawatomiPuebloPuerto RicanPuget Sound SalishRomanianRussianSalvadoranSamoanScandinavianScotch-IrishScottishSeminoleSenegaleseSerbianShoshoneSierra LeoneanSiouxSlavicSlovakSloveneSomaliSouth AfricanSouth AmericanSouth American IndianSoviet UnionSpaniardSpanishSpanish AmericanSpanish American IndianSri LankanSubsaharan AfricanSudaneseSwedishSwissSyrianTaiwaneseThaiTlingit-HaidaTohono O'OdhamTonganTrinidadian and TobagonianTsimshianTurkishU.S. Virgin IslanderUgandanUkrainianUruguayanUteVenezuelanVietnameseWelshWest IndianYakamaYaquiYugoslavianYumanYup'ikZimbabwean
Immigration
NonimmigrantsImmigrantsAfghanistanAfricaAlbaniaArgentinaArmeniaAsiaAustraliaAustriaBahamasBangladeshBarbadosBelarusBelgiumBelizeBoliviaBosnia and HerzegovinaBrazilBulgariaBurma/MyanmarCabo VerdeCambodiaCameroonCanadaCaribbeanCentral AmericaChileChinaColombiaCongoCosta RicaCroatiaCubaCzechoslovakiaDenmarkDominicaDominican RepublicEastern AfricaEastern AsiaEastern EuropeEcuadorEgyptEl SalvadorEnglandEthiopiaEuropeFijiFranceGermanyGhanaGreeceGrenadaGuatemalaGuyanaHaitiHondurasHong KongHungaryIndiaIndonesiaIranIraqIrelandIsraelItalyJamaicaJapanJordanKazakhstanKenyaKoreaKuwaitLaosLatin AmericaLatviaLebanonLiberiaLithuaniaMalaysiaMexicoMicronesiaMiddle AfricaMoldovaMoroccoNepalNetherlandsNicaraguaNigeriaNorth AmericaNorth MacedoniaNorthern AfricaNorthern EuropeNorwayOceaniaPakistanPanamaPeruPhilippinesPolandPortugalRomaniaRussiaSaudi ArabiaScotlandSenegalSerbiaSierra LeoneSingaporeSomaliaSouth AfricaSouth AmericaSouth Central AsiaSouth Eastern AsiaSouthern EuropeSpainSri LankaSt. Vincent and the GrenadinesSudanSwedenSwitzerlandSyriaTaiwanThailandTrinidad and TobagoTurkeyUgandaUkraineUruguayUzbekistanVenezuelaVietnamWest IndiesWestern AfricaWestern AsiaWestern EuropeYemenZaireZimbabweAzores
Married-Couple Family Poverty
Income
Poverty
Unemployment
Labor Participation
Family Structure
Vehicle Availability
Education Level
Disability

Immigrants from Eritrea Married-Couple Family Poverty
Tragic

5.9%
POVERTY | MARRIED-COUPLE FAMILIES
1.1/ 100
METRIC RATING
250th/ 347
METRIC RANK

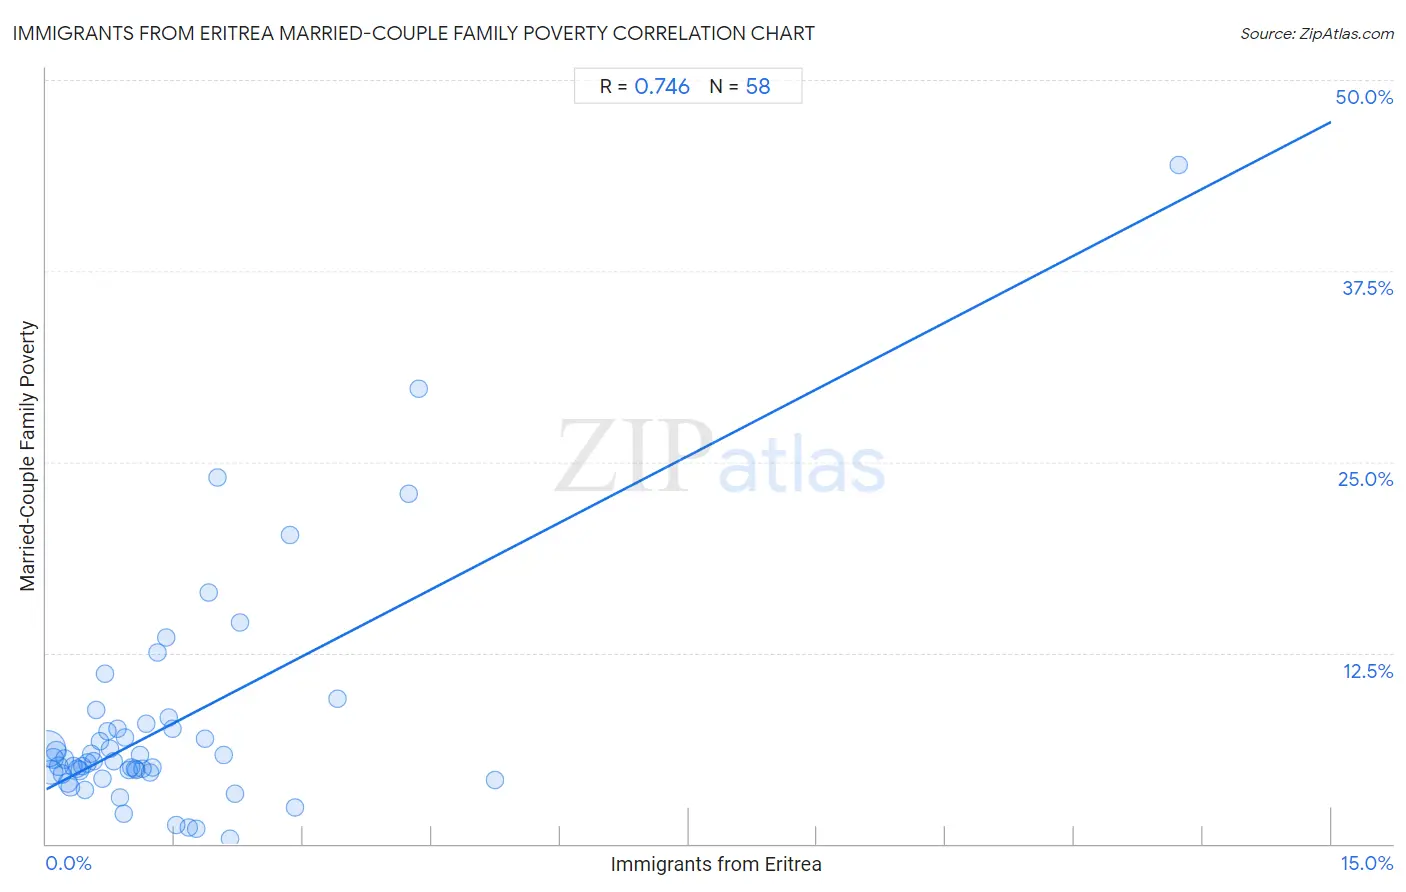
Immigrants from Eritrea Married-Couple Family Poverty Correlation Chart

The statistical analysis conducted on geographies consisting of 104,722,236 people shows a strong positive correlation between the proportion of Immigrants from Eritrea and poverty level among married-couple families in the United States with a correlation coefficient (R) of 0.746 and weighted average of 5.9%. On average, for every 1% (one percent) increase in Immigrants from Eritrea within a typical geography, there is an increase of 2.9% in poverty level among married-couple families.
Immigrants from Eritrea Married-Couple Family Poverty
It is essential to understand that the correlation between the percentage of Immigrants from Eritrea and poverty level among married-couple families does not imply a direct cause-and-effect relationship. It remains uncertain whether the presence of Immigrants from Eritrea influences an upward or downward trend in the level of poverty level among married-couple families within an area, or if Immigrants from Eritrea simply ended up residing in those areas with higher or lower levels of poverty level among married-couple families due to other factors.

Demographics Similar to Immigrants from Eritrea by Married-Couple Family Poverty

In terms of married-couple family poverty, the demographic groups most similar to Immigrants from Eritrea are Tsimshian (5.9%, a difference of 0.21%), Immigrants from Ghana (5.9%, a difference of 0.25%), Cree (5.9%, a difference of 0.31%), Iraqi (5.9%, a difference of 0.74%), and Immigrants from Western Asia (6.0%, a difference of 0.89%).
DemographicsRating | RankMarried-Couple Family Poverty
Somalis
2.3
/100
|
#243
Tragic
5.8%
Chickasaw
2.3
/100
|
#244
Tragic
5.8%
Immigrants from Afghanistan
2.1
/100
|
#245
Tragic
5.8%
Immigrants from Venezuela
1.8
/100
|
#246
Tragic
5.8%
Iraqis
1.4
/100
|
#247
Tragic
5.9%
Cree
1.2
/100
|
#248
Tragic
5.9%
Tsimshian
1.1
/100
|
#249
Tragic
5.9%
Immigrants from Eritrea
1.1
/100
|
#250
Tragic
5.9%
Immigrants from Ghana
1.0
/100
|
#251
Tragic
5.9%
Immigrants from Western Asia
0.7
/100
|
#252
Tragic
6.0%
Africans
0.7
/100
|
#253
Tragic
6.0%
Immigrants from Somalia
0.7
/100
|
#254
Tragic
6.0%
Comanche
0.7
/100
|
#255
Tragic
6.0%
Bangladeshis
0.5
/100
|
#256
Tragic
6.0%
Immigrants from Burma/Myanmar
0.5
/100
|
#257
Tragic
6.0%

Immigrants from Eritrea Married-Couple Family Poverty Correlation Summary

MeasurementImmigrants from Eritrea DataMarried-Couple Family Poverty Data
Minimum0.014%0.29%
Maximum13.2%44.4%
Range13.2%44.2%
Mean1.5%7.8%
Median0.98%5.4%
Interquartile 25% (IQ1)0.49%4.7%
Interquartile 75% (IQ3)1.7%7.5%
Interquartile Range (IQR)1.3%2.8%
Standard Deviation (Sample)1.9%7.5%
Standard Deviation (Population)1.9%7.4%

Correlation Details

Immigrants from Eritrea PercentileSample SizeMarried-Couple Family Poverty
[
0.0%
-
0.5%
]
0.014%
52,561,8406.2%
[
0.0%
-
0.5%
]
0.051%
18,883,9734.7%
[
0.0%
-
0.5%
]
0.082%
8,961,2275.6%
[
0.0%
-
0.5%
]
0.11%
6,694,6486.0%
[
0.0%
-
0.5%
]
0.15%
3,433,1335.1%
[
0.0%
-
0.5%
]
0.19%
2,239,4964.6%
[
0.0%
-
0.5%
]
0.22%
1,655,3105.5%
[
0.0%
-
0.5%
]
0.25%
1,580,5464.0%
[
0.0%
-
0.5%
]
0.28%
1,479,8633.7%
[
0.0%
-
0.5%
]
0.32%
1,477,0645.0%
[
0.0%
-
0.5%
]
0.36%
756,9044.9%
[
0.0%
-
0.5%
]
0.39%
970,8834.8%
[
0.0%
-
0.5%
]
0.43%
545,8415.1%
[
0.0%
-
0.5%
]
0.45%
334,6993.5%
[
0.0%
-
0.5%
]
0.49%
368,8455.3%
[
0.5%
-
1.0%
]
0.52%
184,4235.9%
[
0.5%
-
1.0%
]
0.55%
377,8155.4%
[
0.5%
-
1.0%
]
0.59%
213,3808.8%
[
0.5%
-
1.0%
]
0.62%
192,6706.7%
[
0.5%
-
1.0%
]
0.66%
225,0834.3%
[
0.5%
-
1.0%
]
0.69%
76,58711.1%
[
0.5%
-
1.0%
]
0.72%
33,5397.3%
[
0.5%
-
1.0%
]
0.74%
20,9756.2%
[
0.5%
-
1.0%
]
0.79%
159,2405.4%
[
0.5%
-
1.0%
]
0.83%
163,1707.5%
[
0.5%
-
1.0%
]
0.85%
51,7223.0%
[
0.5%
-
1.0%
]
0.90%
39,7462.0%
[
0.5%
-
1.0%
]
0.92%
101,9507.0%
[
0.5%
-
1.0%
]
0.96%
58,6734.8%
[
0.5%
-
1.0%
]
1.00%
52,7145.0%
[
1.0%
-
1.5%
]
1.03%
65,9944.9%
[
1.0%
-
1.5%
]
1.05%
112,8604.8%
[
1.0%
-
1.5%
]
1.09%
38,5945.8%
[
1.0%
-
1.5%
]
1.13%
95,3314.9%
[
1.0%
-
1.5%
]
1.17%
64,5777.8%
[
1.0%
-
1.5%
]
1.22%
35,7854.7%
[
1.0%
-
1.5%
]
1.25%
30,7885.0%
[
1.0%
-
1.5%
]
1.29%
4,01712.6%
[
1.0%
-
1.5%
]
1.40%
42,59413.5%
[
1.0%
-
1.5%
]
1.43%
69,2038.2%
[
1.0%
-
1.5%
]
1.47%
20,9967.5%
[
1.5%
-
2.0%
]
1.52%
12,0801.2%
[
1.5%
-
2.0%
]
1.67%
8,3411.1%
[
1.5%
-
2.0%
]
1.74%
18,2280.97%
[
1.5%
-
2.0%
]
1.86%
1,9366.9%
[
1.5%
-
2.0%
]
1.89%
2,37816.4%
[
2.0%
-
2.5%
]
2.00%
52,36024.0%
[
2.0%
-
2.5%
]
2.07%
12,7745.8%
[
2.0%
-
2.5%
]
2.14%
2,5680.29%
[
2.0%
-
2.5%
]
2.20%
9,9523.3%
[
2.0%
-
2.5%
]
2.26%
38,62414.5%
[
2.5%
-
3.0%
]
2.85%
37,89820.2%
[
2.5%
-
3.0%
]
2.91%
30,2592.4%
[
3.0%
-
3.5%
]
3.41%
1,8509.5%
[
4.0%
-
4.5%
]
4.23%
14,55322.9%
[
4.0%
-
4.5%
]
4.35%
1,42529.8%
[
5.0%
-
5.5%
]
5.24%
1914.2%
[
13.0%
-
13.5%
]
13.22%
12144.4%