Immigrants from England GED/Equivalency

COMPARE

Immigrants from England
Race
Ancestry
AfghanAfricanAlaska NativeAlaskan AthabascanAlbanianAleutAlsatianAmericanApacheArabArapahoArgentineanArmenianAssyrian/Chaldean/SyriacAustralianAustrianBahamianBangladeshiBarbadianBasqueBelgianBelizeanBermudanBhutaneseBlackfeetBolivianBrazilianBritishBritish West IndianBulgarianBurmeseCajunCambodianCanadianCape VerdeanCarpatho RusynCelticCentral AmericanCentral American IndianCherokeeCheyenneChickasawChileanChineseChippewaChoctawColombianColvilleComancheCosta RicanCreeCreekCroatianCrowCubanCypriotCzechCzechoslovakianDanishDelawareDominicanDutchDutch West IndianEastern EuropeanEcuadorianEgyptianEnglishEstonianEthiopianEuropeanFijianFilipinoFinnishFrenchFrench American IndianFrench CanadianGermanGerman RussianGhanaianGreekGuamanian/ChamorroGuatemalanGuyaneseHaitianHmongHonduranHopiHoumaHungarianIcelanderIndian (Asian)IndonesianInupiatIranianIraqiIrishIroquoisIsraeliItalianJamaicanJapaneseJordanianKenyanKiowaKoreanLaotianLatvianLebaneseLiberianLithuanianLumbeeLuxembourgerMacedonianMalaysianMalteseMarshalleseMenomineeMexicanMexican American IndianMongolianMoroccanNative HawaiianNavajoNepaleseNew ZealanderNicaraguanNigerianNorthern EuropeanNorwegianOkinawanOsageOttawaPaiutePakistaniPalestinianPanamanianParaguayanPennsylvania GermanPeruvianPimaPolishPortuguesePotawatomiPuebloPuerto RicanPuget Sound SalishRomanianRussianSalvadoranSamoanScandinavianScotch-IrishScottishSeminoleSenegaleseSerbianShoshoneSierra LeoneanSiouxSlavicSlovakSloveneSomaliSouth AfricanSouth AmericanSouth American IndianSoviet UnionSpaniardSpanishSpanish AmericanSpanish American IndianSri LankanSubsaharan AfricanSudaneseSwedishSwissSyrianTaiwaneseThaiTlingit-HaidaTohono O'OdhamTonganTrinidadian and TobagonianTsimshianTurkishU.S. Virgin IslanderUgandanUkrainianUruguayanUteVenezuelanVietnameseWelshWest IndianYakamaYaquiYugoslavianYumanYup'ikZimbabwean
Immigration
NonimmigrantsImmigrantsAfghanistanAfricaAlbaniaArgentinaArmeniaAsiaAustraliaAustriaBahamasBangladeshBarbadosBelarusBelgiumBelizeBoliviaBosnia and HerzegovinaBrazilBulgariaBurma/MyanmarCabo VerdeCambodiaCameroonCanadaCaribbeanCentral AmericaChileChinaColombiaCongoCosta RicaCroatiaCubaCzechoslovakiaDenmarkDominicaDominican RepublicEastern AfricaEastern AsiaEastern EuropeEcuadorEgyptEl SalvadorEnglandEritreaEthiopiaEuropeFijiFranceGermanyGhanaGreeceGrenadaGuatemalaGuyanaHaitiHondurasHong KongHungaryIndiaIndonesiaIranIraqIrelandIsraelItalyJamaicaJapanJordanKazakhstanKenyaKoreaKuwaitLaosLatin AmericaLatviaLebanonLiberiaLithuaniaMalaysiaMexicoMicronesiaMiddle AfricaMoldovaMoroccoNepalNetherlandsNicaraguaNigeriaNorth AmericaNorth MacedoniaNorthern AfricaNorthern EuropeNorwayOceaniaPakistanPanamaPeruPhilippinesPolandPortugalRomaniaRussiaSaudi ArabiaScotlandSenegalSerbiaSierra LeoneSingaporeSomaliaSouth AfricaSouth AmericaSouth Central AsiaSouth Eastern AsiaSouthern EuropeSpainSri LankaSt. Vincent and the GrenadinesSudanSwedenSwitzerlandSyriaTaiwanThailandTrinidad and TobagoTurkeyUgandaUkraineUruguayUzbekistanVenezuelaVietnamWest IndiesWestern AfricaWestern AsiaWestern EuropeYemenZaireZimbabweAzores
Select to Compare
Race
Ancestry
AfghanAfricanAlaska NativeAlaskan AthabascanAlbanianAleutAlsatianAmericanApacheArabArapahoArgentineanArmenianAssyrian/Chaldean/SyriacAustralianAustrianBahamianBangladeshiBarbadianBasqueBelgianBelizeanBermudanBhutaneseBlackfeetBolivianBrazilianBritishBritish West IndianBulgarianBurmeseCajunCambodianCanadianCape VerdeanCarpatho RusynCelticCentral AmericanCentral American IndianCherokeeCheyenneChickasawChileanChineseChippewaChoctawColombianColvilleComancheCosta RicanCreeCreekCroatianCrowCubanCypriotCzechCzechoslovakianDanishDelawareDominicanDutchDutch West IndianEastern EuropeanEcuadorianEgyptianEnglishEstonianEthiopianEuropeanFijianFilipinoFinnishFrenchFrench American IndianFrench CanadianGermanGerman RussianGhanaianGreekGuamanian/ChamorroGuatemalanGuyaneseHaitianHmongHonduranHopiHoumaHungarianIcelanderIndian (Asian)IndonesianInupiatIranianIraqiIrishIroquoisIsraeliItalianJamaicanJapaneseJordanianKenyanKiowaKoreanLaotianLatvianLebaneseLiberianLithuanianLumbeeLuxembourgerMacedonianMalaysianMalteseMarshalleseMenomineeMexicanMexican American IndianMongolianMoroccanNative HawaiianNavajoNepaleseNew ZealanderNicaraguanNigerianNorthern EuropeanNorwegianOkinawanOsageOttawaPaiutePakistaniPalestinianPanamanianParaguayanPennsylvania GermanPeruvianPimaPolishPortuguesePotawatomiPuebloPuerto RicanPuget Sound SalishRomanianRussianSalvadoranSamoanScandinavianScotch-IrishScottishSeminoleSenegaleseSerbianShoshoneSierra LeoneanSiouxSlavicSlovakSloveneSomaliSouth AfricanSouth AmericanSouth American IndianSoviet UnionSpaniardSpanishSpanish AmericanSpanish American IndianSri LankanSubsaharan AfricanSudaneseSwedishSwissSyrianTaiwaneseThaiTlingit-HaidaTohono O'OdhamTonganTrinidadian and TobagonianTsimshianTurkishU.S. Virgin IslanderUgandanUkrainianUruguayanUteVenezuelanVietnameseWelshWest IndianYakamaYaquiYugoslavianYumanYup'ikZimbabwean
Immigration
NonimmigrantsImmigrantsAfghanistanAfricaAlbaniaArgentinaArmeniaAsiaAustraliaAustriaBahamasBangladeshBarbadosBelarusBelgiumBelizeBoliviaBosnia and HerzegovinaBrazilBulgariaBurma/MyanmarCabo VerdeCambodiaCameroonCanadaCaribbeanCentral AmericaChileChinaColombiaCongoCosta RicaCroatiaCubaCzechoslovakiaDenmarkDominicaDominican RepublicEastern AfricaEastern AsiaEastern EuropeEcuadorEgyptEl SalvadorEritreaEthiopiaEuropeFijiFranceGermanyGhanaGreeceGrenadaGuatemalaGuyanaHaitiHondurasHong KongHungaryIndiaIndonesiaIranIraqIrelandIsraelItalyJamaicaJapanJordanKazakhstanKenyaKoreaKuwaitLaosLatin AmericaLatviaLebanonLiberiaLithuaniaMalaysiaMexicoMicronesiaMiddle AfricaMoldovaMoroccoNepalNetherlandsNicaraguaNigeriaNorth AmericaNorth MacedoniaNorthern AfricaNorthern EuropeNorwayOceaniaPakistanPanamaPeruPhilippinesPolandPortugalRomaniaRussiaSaudi ArabiaScotlandSenegalSerbiaSierra LeoneSingaporeSomaliaSouth AfricaSouth AmericaSouth Central AsiaSouth Eastern AsiaSouthern EuropeSpainSri LankaSt. Vincent and the GrenadinesSudanSwedenSwitzerlandSyriaTaiwanThailandTrinidad and TobagoTurkeyUgandaUkraineUruguayUzbekistanVenezuelaVietnamWest IndiesWestern AfricaWestern AsiaWestern EuropeYemenZaireZimbabweAzores
GED/Equivalency
Income
Poverty
Unemployment
Labor Participation
Family Structure
Vehicle Availability
Education Level
Disability

Immigrants from England GED/Equivalency
Exceptional

87.6%
GED/EQUIVALENCY
98.5/ 100
METRIC RATING
80th/ 347
METRIC RANK

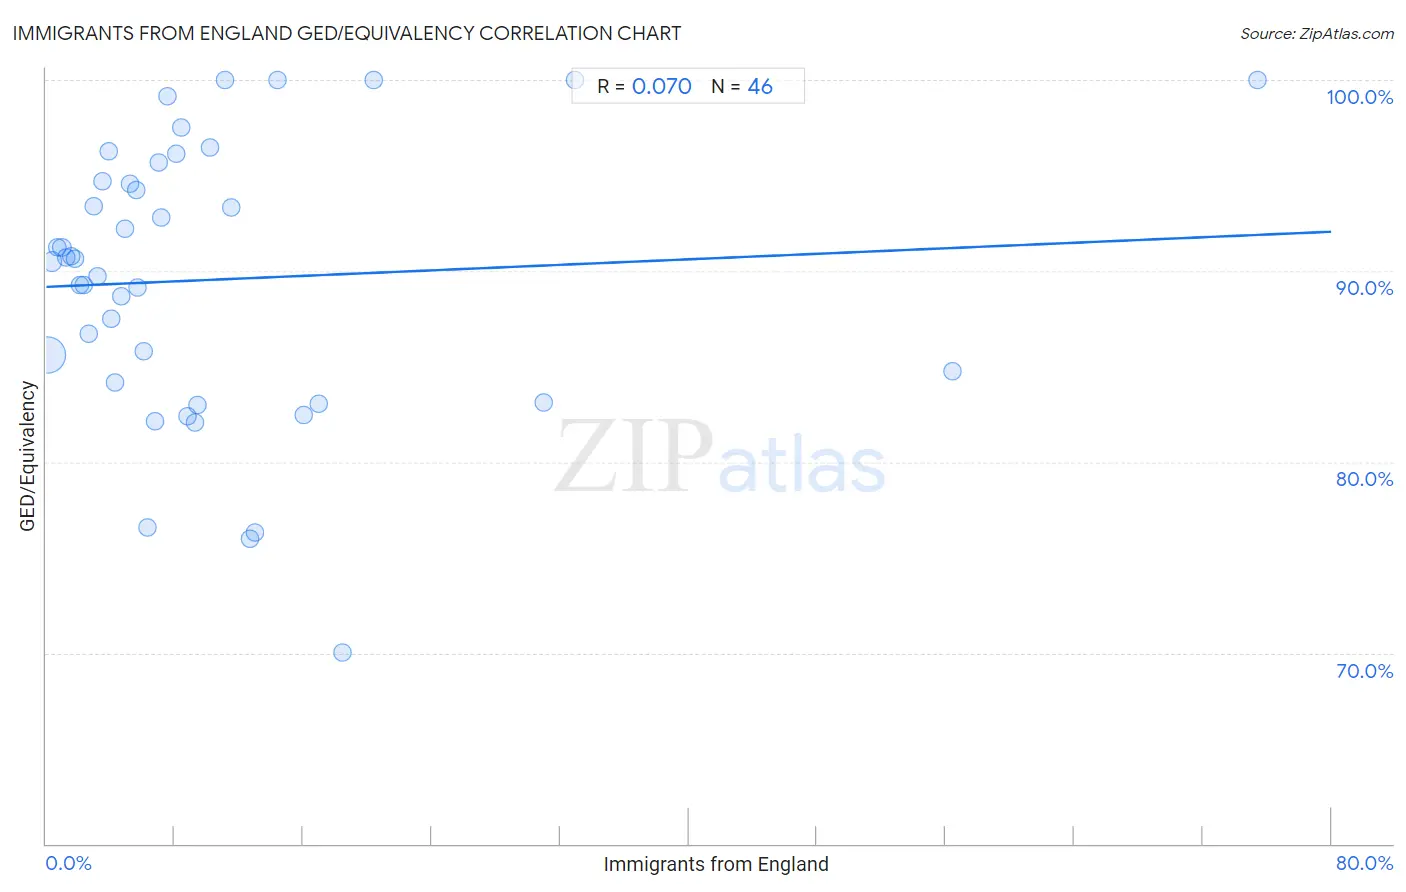
Immigrants from England GED/Equivalency Correlation Chart

The statistical analysis conducted on geographies consisting of 391,897,612 people shows a slight positive correlation between the proportion of Immigrants from England and percentage of population with at least ged/equivalency education in the United States with a correlation coefficient (R) of 0.070 and weighted average of 87.6%. On average, for every 1% (one percent) increase in Immigrants from England within a typical geography, there is an increase of 0.036% in percentage of population with at least ged/equivalency education.
Immigrants from England GED/Equivalency
It is essential to understand that the correlation between the percentage of Immigrants from England and percentage of population with at least ged/equivalency education does not imply a direct cause-and-effect relationship. It remains uncertain whether the presence of Immigrants from England influences an upward or downward trend in the level of percentage of population with at least ged/equivalency education within an area, or if Immigrants from England simply ended up residing in those areas with higher or lower levels of percentage of population with at least ged/equivalency education due to other factors.

Demographics Similar to Immigrants from England by GED/Equivalency

In terms of ged/equivalency, the demographic groups most similar to Immigrants from England are English (87.6%, a difference of 0.030%), Immigrants from Sri Lanka (87.5%, a difference of 0.040%), Romanian (87.5%, a difference of 0.050%), South African (87.5%, a difference of 0.050%), and Irish (87.6%, a difference of 0.060%).
DemographicsRating | RankGED/Equivalency
Belgians
98.8
/100
|
#73
Exceptional
87.7%
Immigrants from Kuwait
98.8
/100
|
#74
Exceptional
87.7%
Scottish
98.7
/100
|
#75
Exceptional
87.7%
Immigrants from Serbia
98.7
/100
|
#76
Exceptional
87.7%
Slavs
98.7
/100
|
#77
Exceptional
87.7%
Irish
98.6
/100
|
#78
Exceptional
87.6%
English
98.6
/100
|
#79
Exceptional
87.6%
Immigrants from England
98.5
/100
|
#80
Exceptional
87.6%
Immigrants from Sri Lanka
98.3
/100
|
#81
Exceptional
87.5%
Romanians
98.3
/100
|
#82
Exceptional
87.5%
South Africans
98.3
/100
|
#83
Exceptional
87.5%
Immigrants from Romania
98.1
/100
|
#84
Exceptional
87.5%
Dutch
98.1
/100
|
#85
Exceptional
87.5%
Immigrants from Europe
98.1
/100
|
#86
Exceptional
87.5%
Native Hawaiians
98.1
/100
|
#87
Exceptional
87.5%

Immigrants from England GED/Equivalency Correlation Summary

MeasurementImmigrants from England DataGED/Equivalency Data
Minimum0.098%70.0%
Maximum75.4%100.0%
Range75.3%30.0%
Mean10.6%89.5%
Median6.5%90.6%
Interquartile 25% (IQ1)3.2%84.2%
Interquartile 75% (IQ3)11.5%94.7%
Interquartile Range (IQR)8.3%10.5%
Standard Deviation (Sample)14.0%7.2%
Standard Deviation (Population)13.9%7.1%

Correlation Details

Immigrants from England PercentileSample SizeGED/Equivalency
[
0.0%
-
0.5%
]
0.098%
347,342,53885.6%
[
0.0%
-
0.5%
]
0.38%
34,814,42190.5%
[
0.5%
-
1.0%
]
0.68%
6,515,38591.2%
[
0.5%
-
1.0%
]
0.97%
1,740,77491.2%
[
1.0%
-
1.5%
]
1.23%
711,24190.7%
[
1.5%
-
2.0%
]
1.53%
306,74290.7%
[
1.5%
-
2.0%
]
1.82%
148,83090.6%
[
2.0%
-
2.5%
]
2.11%
69,03089.3%
[
2.0%
-
2.5%
]
2.37%
61,84589.2%
[
2.5%
-
3.0%
]
2.66%
31,68886.7%
[
2.5%
-
3.0%
]
2.98%
35,87793.4%
[
3.0%
-
3.5%
]
3.23%
22,79989.7%
[
3.0%
-
3.5%
]
3.50%
13,00194.7%
[
3.5%
-
4.0%
]
3.87%
6,84396.2%
[
4.0%
-
4.5%
]
4.08%
9,31687.5%
[
4.0%
-
4.5%
]
4.31%
18,40884.2%
[
4.5%
-
5.0%
]
4.66%
17,87888.7%
[
4.5%
-
5.0%
]
4.93%
9,49592.2%
[
5.0%
-
5.5%
]
5.21%
4,04994.6%
[
5.5%
-
6.0%
]
5.57%
4,04194.2%
[
5.5%
-
6.0%
]
5.70%
2,68589.2%
[
6.0%
-
6.5%
]
6.06%
1,28785.8%
[
6.0%
-
6.5%
]
6.31%
63476.6%
[
6.5%
-
7.0%
]
6.73%
59482.2%
[
6.5%
-
7.0%
]
6.97%
1,21995.7%
[
7.0%
-
7.5%
]
7.19%
13992.8%
[
7.5%
-
8.0%
]
7.54%
49199.1%
[
8.0%
-
8.5%
]
8.08%
58296.1%
[
8.0%
-
8.5%
]
8.41%
34597.5%
[
8.5%
-
9.0%
]
8.78%
46782.4%
[
9.0%
-
9.5%
]
9.26%
99382.1%
[
9.0%
-
9.5%
]
9.41%
87183.0%
[
10.0%
-
10.5%
]
10.20%
46196.5%
[
11.0%
-
11.5%
]
11.11%
45100.0%
[
11.5%
-
12.0%
]
11.54%
15693.3%
[
12.5%
-
13.0%
]
12.71%
29176.0%
[
13.0%
-
13.5%
]
13.03%
23876.3%
[
14.0%
-
14.5%
]
14.36%
188100.0%
[
16.0%
-
16.5%
]
16.04%
63682.5%
[
16.5%
-
17.0%
]
16.98%
10683.0%
[
18.0%
-
18.5%
]
18.42%
3870.0%
[
20.0%
-
20.5%
]
20.39%
152100.0%
[
30.5%
-
31.0%
]
30.99%
7183.1%
[
32.5%
-
33.0%
]
32.92%
161100.0%
[
56.0%
-
56.5%
]
56.39%
32184.7%
[
75.0%
-
75.5%
]
75.42%
240100.0%