Immigrants from England 3 or more Vehicles in Household

COMPARE

Immigrants from England
Race
Ancestry
AfghanAfricanAlaska NativeAlaskan AthabascanAlbanianAleutAlsatianAmericanApacheArabArapahoArgentineanArmenianAssyrian/Chaldean/SyriacAustralianAustrianBahamianBangladeshiBarbadianBasqueBelgianBelizeanBermudanBhutaneseBlackfeetBolivianBrazilianBritishBritish West IndianBulgarianBurmeseCajunCambodianCanadianCape VerdeanCarpatho RusynCelticCentral AmericanCentral American IndianCherokeeCheyenneChickasawChileanChineseChippewaChoctawColombianColvilleComancheCosta RicanCreeCreekCroatianCrowCubanCypriotCzechCzechoslovakianDanishDelawareDominicanDutchDutch West IndianEastern EuropeanEcuadorianEgyptianEnglishEstonianEthiopianEuropeanFijianFilipinoFinnishFrenchFrench American IndianFrench CanadianGermanGerman RussianGhanaianGreekGuamanian/ChamorroGuatemalanGuyaneseHaitianHmongHonduranHopiHoumaHungarianIcelanderIndian (Asian)IndonesianInupiatIranianIraqiIrishIroquoisIsraeliItalianJamaicanJapaneseJordanianKenyanKiowaKoreanLaotianLatvianLebaneseLiberianLithuanianLumbeeLuxembourgerMacedonianMalaysianMalteseMarshalleseMenomineeMexicanMexican American IndianMongolianMoroccanNative HawaiianNavajoNepaleseNew ZealanderNicaraguanNigerianNorthern EuropeanNorwegianOkinawanOsageOttawaPaiutePakistaniPalestinianPanamanianParaguayanPennsylvania GermanPeruvianPimaPolishPortuguesePotawatomiPuebloPuerto RicanPuget Sound SalishRomanianRussianSalvadoranSamoanScandinavianScotch-IrishScottishSeminoleSenegaleseSerbianShoshoneSierra LeoneanSiouxSlavicSlovakSloveneSomaliSouth AfricanSouth AmericanSouth American IndianSoviet UnionSpaniardSpanishSpanish AmericanSpanish American IndianSri LankanSubsaharan AfricanSudaneseSwedishSwissSyrianTaiwaneseThaiTlingit-HaidaTohono O'OdhamTonganTrinidadian and TobagonianTsimshianTurkishU.S. Virgin IslanderUgandanUkrainianUruguayanUteVenezuelanVietnameseWelshWest IndianYakamaYaquiYugoslavianYumanYup'ikZimbabwean
Immigration
NonimmigrantsImmigrantsAfghanistanAfricaAlbaniaArgentinaArmeniaAsiaAustraliaAustriaBahamasBangladeshBarbadosBelarusBelgiumBelizeBoliviaBosnia and HerzegovinaBrazilBulgariaBurma/MyanmarCabo VerdeCambodiaCameroonCanadaCaribbeanCentral AmericaChileChinaColombiaCongoCosta RicaCroatiaCubaCzechoslovakiaDenmarkDominicaDominican RepublicEastern AfricaEastern AsiaEastern EuropeEcuadorEgyptEl SalvadorEnglandEritreaEthiopiaEuropeFijiFranceGermanyGhanaGreeceGrenadaGuatemalaGuyanaHaitiHondurasHong KongHungaryIndiaIndonesiaIranIraqIrelandIsraelItalyJamaicaJapanJordanKazakhstanKenyaKoreaKuwaitLaosLatin AmericaLatviaLebanonLiberiaLithuaniaMalaysiaMexicoMicronesiaMiddle AfricaMoldovaMoroccoNepalNetherlandsNicaraguaNigeriaNorth AmericaNorth MacedoniaNorthern AfricaNorthern EuropeNorwayOceaniaPakistanPanamaPeruPhilippinesPolandPortugalRomaniaRussiaSaudi ArabiaScotlandSenegalSerbiaSierra LeoneSingaporeSomaliaSouth AfricaSouth AmericaSouth Central AsiaSouth Eastern AsiaSouthern EuropeSpainSri LankaSt. Vincent and the GrenadinesSudanSwedenSwitzerlandSyriaTaiwanThailandTrinidad and TobagoTurkeyUgandaUkraineUruguayUzbekistanVenezuelaVietnamWest IndiesWestern AfricaWestern AsiaWestern EuropeYemenZaireZimbabweAzores
Select to Compare
Race
Ancestry
AfghanAfricanAlaska NativeAlaskan AthabascanAlbanianAleutAlsatianAmericanApacheArabArapahoArgentineanArmenianAssyrian/Chaldean/SyriacAustralianAustrianBahamianBangladeshiBarbadianBasqueBelgianBelizeanBermudanBhutaneseBlackfeetBolivianBrazilianBritishBritish West IndianBulgarianBurmeseCajunCambodianCanadianCape VerdeanCarpatho RusynCelticCentral AmericanCentral American IndianCherokeeCheyenneChickasawChileanChineseChippewaChoctawColombianColvilleComancheCosta RicanCreeCreekCroatianCrowCubanCypriotCzechCzechoslovakianDanishDelawareDominicanDutchDutch West IndianEastern EuropeanEcuadorianEgyptianEnglishEstonianEthiopianEuropeanFijianFilipinoFinnishFrenchFrench American IndianFrench CanadianGermanGerman RussianGhanaianGreekGuamanian/ChamorroGuatemalanGuyaneseHaitianHmongHonduranHopiHoumaHungarianIcelanderIndian (Asian)IndonesianInupiatIranianIraqiIrishIroquoisIsraeliItalianJamaicanJapaneseJordanianKenyanKiowaKoreanLaotianLatvianLebaneseLiberianLithuanianLumbeeLuxembourgerMacedonianMalaysianMalteseMarshalleseMenomineeMexicanMexican American IndianMongolianMoroccanNative HawaiianNavajoNepaleseNew ZealanderNicaraguanNigerianNorthern EuropeanNorwegianOkinawanOsageOttawaPaiutePakistaniPalestinianPanamanianParaguayanPennsylvania GermanPeruvianPimaPolishPortuguesePotawatomiPuebloPuerto RicanPuget Sound SalishRomanianRussianSalvadoranSamoanScandinavianScotch-IrishScottishSeminoleSenegaleseSerbianShoshoneSierra LeoneanSiouxSlavicSlovakSloveneSomaliSouth AfricanSouth AmericanSouth American IndianSoviet UnionSpaniardSpanishSpanish AmericanSpanish American IndianSri LankanSubsaharan AfricanSudaneseSwedishSwissSyrianTaiwaneseThaiTlingit-HaidaTohono O'OdhamTonganTrinidadian and TobagonianTsimshianTurkishU.S. Virgin IslanderUgandanUkrainianUruguayanUteVenezuelanVietnameseWelshWest IndianYakamaYaquiYugoslavianYumanYup'ikZimbabwean
Immigration
NonimmigrantsImmigrantsAfghanistanAfricaAlbaniaArgentinaArmeniaAsiaAustraliaAustriaBahamasBangladeshBarbadosBelarusBelgiumBelizeBoliviaBosnia and HerzegovinaBrazilBulgariaBurma/MyanmarCabo VerdeCambodiaCameroonCanadaCaribbeanCentral AmericaChileChinaColombiaCongoCosta RicaCroatiaCubaCzechoslovakiaDenmarkDominicaDominican RepublicEastern AfricaEastern AsiaEastern EuropeEcuadorEgyptEl SalvadorEritreaEthiopiaEuropeFijiFranceGermanyGhanaGreeceGrenadaGuatemalaGuyanaHaitiHondurasHong KongHungaryIndiaIndonesiaIranIraqIrelandIsraelItalyJamaicaJapanJordanKazakhstanKenyaKoreaKuwaitLaosLatin AmericaLatviaLebanonLiberiaLithuaniaMalaysiaMexicoMicronesiaMiddle AfricaMoldovaMoroccoNepalNetherlandsNicaraguaNigeriaNorth AmericaNorth MacedoniaNorthern AfricaNorthern EuropeNorwayOceaniaPakistanPanamaPeruPhilippinesPolandPortugalRomaniaRussiaSaudi ArabiaScotlandSenegalSerbiaSierra LeoneSingaporeSomaliaSouth AfricaSouth AmericaSouth Central AsiaSouth Eastern AsiaSouthern EuropeSpainSri LankaSt. Vincent and the GrenadinesSudanSwedenSwitzerlandSyriaTaiwanThailandTrinidad and TobagoTurkeyUgandaUkraineUruguayUzbekistanVenezuelaVietnamWest IndiesWestern AfricaWestern AsiaWestern EuropeYemenZaireZimbabweAzores
3 or more Vehicles in Household
Income
Poverty
Unemployment
Labor Participation
Family Structure
Vehicle Availability
Education Level
Disability

Immigrants from England 3 or more Vehicles in Household
Exceptional

20.7%
3+ VEHICLES AVAILABLE
96.2/ 100
METRIC RATING
113th/ 347
METRIC RANK

Immigrants from England 3 or more Vehicles in Household Correlation Chart

The statistical analysis conducted on geographies consisting of 391,649,997 people shows a slight negative correlation between the proportion of Immigrants from England and percentage of households with 3 or more vehicles available in the United States with a correlation coefficient (R) of -0.071 and weighted average of 20.7%. On average, for every 1% (one percent) increase in Immigrants from England within a typical geography, there is a decrease of 0.062% in percentage of households with 3 or more vehicles available.
Immigrants from England 3 or more Vehicles in Household
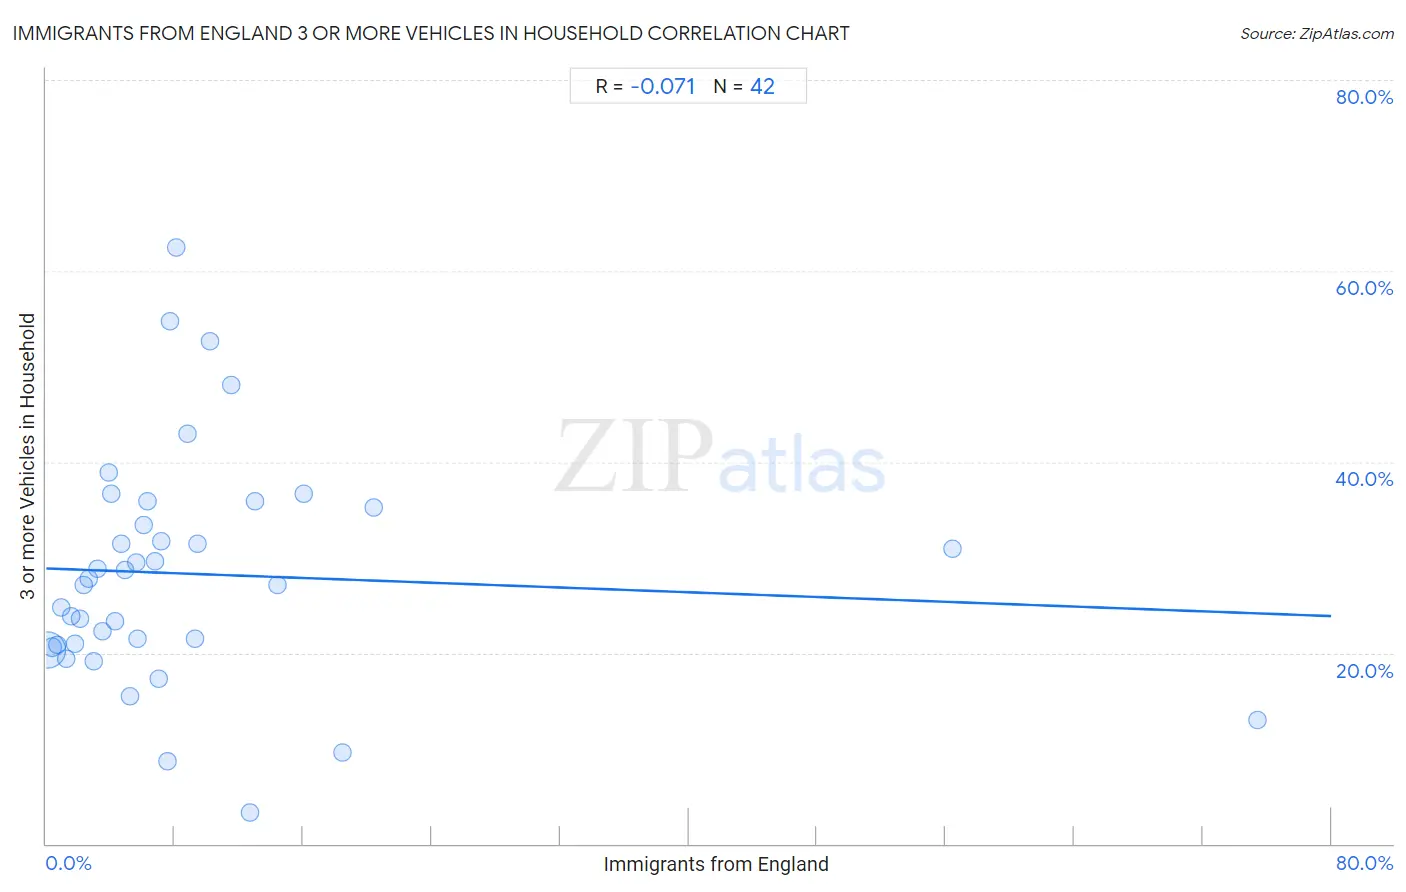
It is essential to understand that the correlation between the percentage of Immigrants from England and percentage of households with 3 or more vehicles available does not imply a direct cause-and-effect relationship. It remains uncertain whether the presence of Immigrants from England influences an upward or downward trend in the level of percentage of households with 3 or more vehicles available within an area, or if Immigrants from England simply ended up residing in those areas with higher or lower levels of percentage of households with 3 or more vehicles available due to other factors.

Demographics Similar to Immigrants from England by 3 or more Vehicles in Household

In terms of 3 or more vehicles in household, the demographic groups most similar to Immigrants from England are Nicaraguan (20.7%, a difference of 0.010%), Burmese (20.6%, a difference of 0.18%), Immigrants from Micronesia (20.7%, a difference of 0.30%), Asian (20.8%, a difference of 0.33%), and Filipino (20.8%, a difference of 0.47%).
DemographicsRating | Rank3 or more Vehicles in Household
Bolivians
97.4
/100
|
#106
Exceptional
20.8%
Immigrants from Germany
97.4
/100
|
#107
Exceptional
20.8%
Immigrants from Scotland
97.1
/100
|
#108
Exceptional
20.8%
Filipinos
97.0
/100
|
#109
Exceptional
20.8%
Asians
96.8
/100
|
#110
Exceptional
20.8%
Immigrants from Micronesia
96.7
/100
|
#111
Exceptional
20.7%
Nicaraguans
96.2
/100
|
#112
Exceptional
20.7%
Immigrants from England
96.2
/100
|
#113
Exceptional
20.7%
Burmese
95.8
/100
|
#114
Exceptional
20.6%
French Canadians
95.0
/100
|
#115
Exceptional
20.6%
Italians
94.9
/100
|
#116
Exceptional
20.6%
Croatians
94.9
/100
|
#117
Exceptional
20.6%
Costa Ricans
94.6
/100
|
#118
Exceptional
20.6%
Immigrants from Latin America
94.5
/100
|
#119
Exceptional
20.5%
Maltese
93.9
/100
|
#120
Exceptional
20.5%

Immigrants from England 3 or more Vehicles in Household Correlation Summary

MeasurementImmigrants from England Data3 or more Vehicles in Household Data
Minimum0.098%3.3%
Maximum75.4%62.4%
Range75.3%59.1%
Mean9.4%28.2%
Median5.9%27.4%
Interquartile 25% (IQ1)3.0%20.8%
Interquartile 75% (IQ3)9.4%35.2%
Interquartile Range (IQR)6.4%14.4%
Standard Deviation (Sample)13.8%12.1%
Standard Deviation (Population)13.7%12.0%

Correlation Details

Immigrants from England PercentileSample Size3 or more Vehicles in Household
[
0.0%
-
0.5%
]
0.098%
347,236,75520.3%
[
0.0%
-
0.5%
]
0.38%
34,720,30620.6%
[
0.5%
-
1.0%
]
0.68%
6,488,70320.8%
[
0.5%
-
1.0%
]
0.97%
1,731,24424.8%
[
1.0%
-
1.5%
]
1.23%
707,01819.4%
[
1.5%
-
2.0%
]
1.53%
306,74223.9%
[
1.5%
-
2.0%
]
1.82%
147,13320.9%
[
2.0%
-
2.5%
]
2.11%
68,23423.6%
[
2.0%
-
2.5%
]
2.36%
59,21327.1%
[
2.5%
-
3.0%
]
2.66%
31,16427.7%
[
2.5%
-
3.0%
]
2.98%
35,71019.1%
[
3.0%
-
3.5%
]
3.23%
22,79928.8%
[
3.0%
-
3.5%
]
3.50%
13,00122.2%
[
3.5%
-
4.0%
]
3.87%
6,79038.9%
[
4.0%
-
4.5%
]
4.08%
9,31636.6%
[
4.0%
-
4.5%
]
4.31%
18,29723.3%
[
4.5%
-
5.0%
]
4.66%
17,55231.4%
[
4.5%
-
5.0%
]
4.93%
9,49528.6%
[
5.0%
-
5.5%
]
5.21%
4,04915.4%
[
5.5%
-
6.0%
]
5.57%
4,04129.5%
[
5.5%
-
6.0%
]
5.70%
2,68521.5%
[
6.0%
-
6.5%
]
6.06%
1,28733.4%
[
6.0%
-
6.5%
]
6.31%
63435.9%
[
6.5%
-
7.0%
]
6.73%
59429.6%
[
6.5%
-
7.0%
]
6.99%
90117.3%
[
7.0%
-
7.5%
]
7.19%
13931.6%
[
7.5%
-
8.0%
]
7.54%
4918.6%
[
7.5%
-
8.0%
]
7.71%
38954.7%
[
8.0%
-
8.5%
]
8.08%
58262.4%
[
8.5%
-
9.0%
]
8.78%
46742.9%
[
9.0%
-
9.5%
]
9.26%
99321.5%
[
9.0%
-
9.5%
]
9.42%
55231.4%
[
10.0%
-
10.5%
]
10.20%
46152.7%
[
11.5%
-
12.0%
]
11.54%
15648.1%
[
12.5%
-
13.0%
]
12.71%
2913.3%
[
13.0%
-
13.5%
]
13.03%
23835.9%
[
14.0%
-
14.5%
]
14.36%
18827.0%
[
16.0%
-
16.5%
]
16.04%
63636.6%
[
18.0%
-
18.5%
]
18.42%
389.5%
[
20.0%
-
20.5%
]
20.39%
15235.2%
[
56.0%
-
56.5%
]
56.39%
32130.9%
[
75.0%
-
75.5%
]
75.42%
24013.0%