Immigrants from England Married-couple Households

COMPARE

Immigrants from England
Race
Ancestry
AfghanAfricanAlaska NativeAlaskan AthabascanAlbanianAleutAlsatianAmericanApacheArabArapahoArgentineanArmenianAssyrian/Chaldean/SyriacAustralianAustrianBahamianBangladeshiBarbadianBasqueBelgianBelizeanBermudanBhutaneseBlackfeetBolivianBrazilianBritishBritish West IndianBulgarianBurmeseCajunCambodianCanadianCape VerdeanCarpatho RusynCelticCentral AmericanCentral American IndianCherokeeCheyenneChickasawChileanChineseChippewaChoctawColombianColvilleComancheCosta RicanCreeCreekCroatianCrowCubanCypriotCzechCzechoslovakianDanishDelawareDominicanDutchDutch West IndianEastern EuropeanEcuadorianEgyptianEnglishEstonianEthiopianEuropeanFijianFilipinoFinnishFrenchFrench American IndianFrench CanadianGermanGerman RussianGhanaianGreekGuamanian/ChamorroGuatemalanGuyaneseHaitianHmongHonduranHopiHoumaHungarianIcelanderIndian (Asian)IndonesianInupiatIranianIraqiIrishIroquoisIsraeliItalianJamaicanJapaneseJordanianKenyanKiowaKoreanLaotianLatvianLebaneseLiberianLithuanianLumbeeLuxembourgerMacedonianMalaysianMalteseMarshalleseMenomineeMexicanMexican American IndianMongolianMoroccanNative HawaiianNavajoNepaleseNew ZealanderNicaraguanNigerianNorthern EuropeanNorwegianOkinawanOsageOttawaPaiutePakistaniPalestinianPanamanianParaguayanPennsylvania GermanPeruvianPimaPolishPortuguesePotawatomiPuebloPuerto RicanPuget Sound SalishRomanianRussianSalvadoranSamoanScandinavianScotch-IrishScottishSeminoleSenegaleseSerbianShoshoneSierra LeoneanSiouxSlavicSlovakSloveneSomaliSouth AfricanSouth AmericanSouth American IndianSoviet UnionSpaniardSpanishSpanish AmericanSpanish American IndianSri LankanSubsaharan AfricanSudaneseSwedishSwissSyrianTaiwaneseThaiTlingit-HaidaTohono O'OdhamTonganTrinidadian and TobagonianTsimshianTurkishU.S. Virgin IslanderUgandanUkrainianUruguayanUteVenezuelanVietnameseWelshWest IndianYakamaYaquiYugoslavianYumanYup'ikZimbabwean
Immigration
NonimmigrantsImmigrantsAfghanistanAfricaAlbaniaArgentinaArmeniaAsiaAustraliaAustriaBahamasBangladeshBarbadosBelarusBelgiumBelizeBoliviaBosnia and HerzegovinaBrazilBulgariaBurma/MyanmarCabo VerdeCambodiaCameroonCanadaCaribbeanCentral AmericaChileChinaColombiaCongoCosta RicaCroatiaCubaCzechoslovakiaDenmarkDominicaDominican RepublicEastern AfricaEastern AsiaEastern EuropeEcuadorEgyptEl SalvadorEnglandEritreaEthiopiaEuropeFijiFranceGermanyGhanaGreeceGrenadaGuatemalaGuyanaHaitiHondurasHong KongHungaryIndiaIndonesiaIranIraqIrelandIsraelItalyJamaicaJapanJordanKazakhstanKenyaKoreaKuwaitLaosLatin AmericaLatviaLebanonLiberiaLithuaniaMalaysiaMexicoMicronesiaMiddle AfricaMoldovaMoroccoNepalNetherlandsNicaraguaNigeriaNorth AmericaNorth MacedoniaNorthern AfricaNorthern EuropeNorwayOceaniaPakistanPanamaPeruPhilippinesPolandPortugalRomaniaRussiaSaudi ArabiaScotlandSenegalSerbiaSierra LeoneSingaporeSomaliaSouth AfricaSouth AmericaSouth Central AsiaSouth Eastern AsiaSouthern EuropeSpainSri LankaSt. Vincent and the GrenadinesSudanSwedenSwitzerlandSyriaTaiwanThailandTrinidad and TobagoTurkeyUgandaUkraineUruguayUzbekistanVenezuelaVietnamWest IndiesWestern AfricaWestern AsiaWestern EuropeYemenZaireZimbabweAzores
Select to Compare
Race
Ancestry
AfghanAfricanAlaska NativeAlaskan AthabascanAlbanianAleutAlsatianAmericanApacheArabArapahoArgentineanArmenianAssyrian/Chaldean/SyriacAustralianAustrianBahamianBangladeshiBarbadianBasqueBelgianBelizeanBermudanBhutaneseBlackfeetBolivianBrazilianBritishBritish West IndianBulgarianBurmeseCajunCambodianCanadianCape VerdeanCarpatho RusynCelticCentral AmericanCentral American IndianCherokeeCheyenneChickasawChileanChineseChippewaChoctawColombianColvilleComancheCosta RicanCreeCreekCroatianCrowCubanCypriotCzechCzechoslovakianDanishDelawareDominicanDutchDutch West IndianEastern EuropeanEcuadorianEgyptianEnglishEstonianEthiopianEuropeanFijianFilipinoFinnishFrenchFrench American IndianFrench CanadianGermanGerman RussianGhanaianGreekGuamanian/ChamorroGuatemalanGuyaneseHaitianHmongHonduranHopiHoumaHungarianIcelanderIndian (Asian)IndonesianInupiatIranianIraqiIrishIroquoisIsraeliItalianJamaicanJapaneseJordanianKenyanKiowaKoreanLaotianLatvianLebaneseLiberianLithuanianLumbeeLuxembourgerMacedonianMalaysianMalteseMarshalleseMenomineeMexicanMexican American IndianMongolianMoroccanNative HawaiianNavajoNepaleseNew ZealanderNicaraguanNigerianNorthern EuropeanNorwegianOkinawanOsageOttawaPaiutePakistaniPalestinianPanamanianParaguayanPennsylvania GermanPeruvianPimaPolishPortuguesePotawatomiPuebloPuerto RicanPuget Sound SalishRomanianRussianSalvadoranSamoanScandinavianScotch-IrishScottishSeminoleSenegaleseSerbianShoshoneSierra LeoneanSiouxSlavicSlovakSloveneSomaliSouth AfricanSouth AmericanSouth American IndianSoviet UnionSpaniardSpanishSpanish AmericanSpanish American IndianSri LankanSubsaharan AfricanSudaneseSwedishSwissSyrianTaiwaneseThaiTlingit-HaidaTohono O'OdhamTonganTrinidadian and TobagonianTsimshianTurkishU.S. Virgin IslanderUgandanUkrainianUruguayanUteVenezuelanVietnameseWelshWest IndianYakamaYaquiYugoslavianYumanYup'ikZimbabwean
Immigration
NonimmigrantsImmigrantsAfghanistanAfricaAlbaniaArgentinaArmeniaAsiaAustraliaAustriaBahamasBangladeshBarbadosBelarusBelgiumBelizeBoliviaBosnia and HerzegovinaBrazilBulgariaBurma/MyanmarCabo VerdeCambodiaCameroonCanadaCaribbeanCentral AmericaChileChinaColombiaCongoCosta RicaCroatiaCubaCzechoslovakiaDenmarkDominicaDominican RepublicEastern AfricaEastern AsiaEastern EuropeEcuadorEgyptEl SalvadorEritreaEthiopiaEuropeFijiFranceGermanyGhanaGreeceGrenadaGuatemalaGuyanaHaitiHondurasHong KongHungaryIndiaIndonesiaIranIraqIrelandIsraelItalyJamaicaJapanJordanKazakhstanKenyaKoreaKuwaitLaosLatin AmericaLatviaLebanonLiberiaLithuaniaMalaysiaMexicoMicronesiaMiddle AfricaMoldovaMoroccoNepalNetherlandsNicaraguaNigeriaNorth AmericaNorth MacedoniaNorthern AfricaNorthern EuropeNorwayOceaniaPakistanPanamaPeruPhilippinesPolandPortugalRomaniaRussiaSaudi ArabiaScotlandSenegalSerbiaSierra LeoneSingaporeSomaliaSouth AfricaSouth AmericaSouth Central AsiaSouth Eastern AsiaSouthern EuropeSpainSri LankaSt. Vincent and the GrenadinesSudanSwedenSwitzerlandSyriaTaiwanThailandTrinidad and TobagoTurkeyUgandaUkraineUruguayUzbekistanVenezuelaVietnamWest IndiesWestern AfricaWestern AsiaWestern EuropeYemenZaireZimbabweAzores
Married-couple Households
Income
Poverty
Unemployment
Labor Participation
Family Structure
Vehicle Availability
Education Level
Disability

Immigrants from England Married-couple Households
Exceptional

48.2%
MARRIED-COUPLE HOUSEHOLDS
98.4/ 100
METRIC RATING
75th/ 347
METRIC RANK

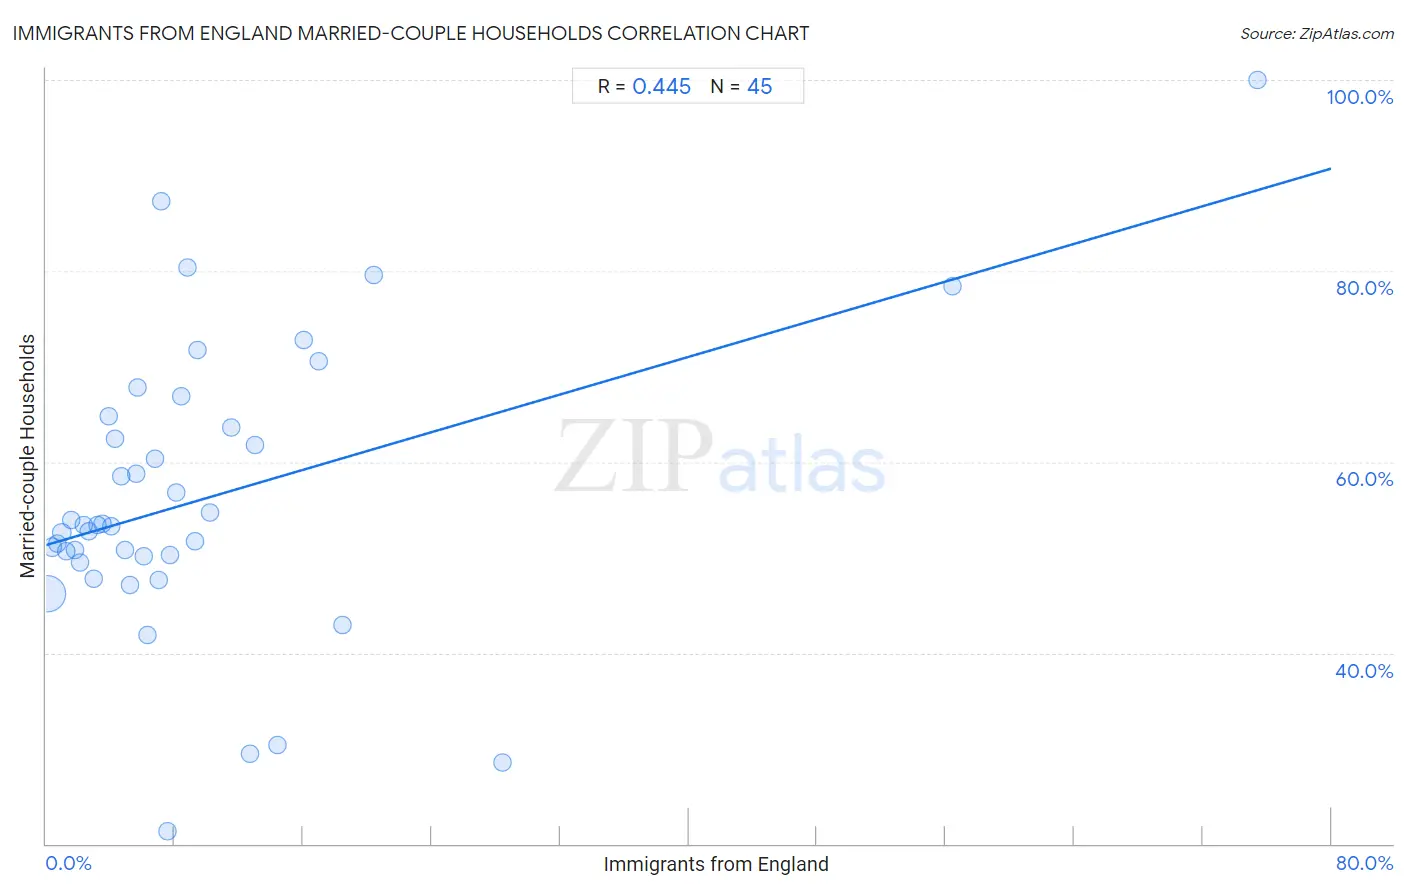
Immigrants from England Married-couple Households Correlation Chart

The statistical analysis conducted on geographies consisting of 391,752,954 people shows a moderate positive correlation between the proportion of Immigrants from England and percentage of married-couple family households in the United States with a correlation coefficient (R) of 0.445 and weighted average of 48.2%. On average, for every 1% (one percent) increase in Immigrants from England within a typical geography, there is an increase of 0.49% in percentage of married-couple family households.
Immigrants from England Married-couple Households
It is essential to understand that the correlation between the percentage of Immigrants from England and percentage of married-couple family households does not imply a direct cause-and-effect relationship. It remains uncertain whether the presence of Immigrants from England influences an upward or downward trend in the level of percentage of married-couple family households within an area, or if Immigrants from England simply ended up residing in those areas with higher or lower levels of percentage of married-couple family households due to other factors.

Demographics Similar to Immigrants from England by Married-couple Households

In terms of married-couple households, the demographic groups most similar to Immigrants from England are Immigrants from Fiji (48.2%, a difference of 0.0%), Immigrants from Romania (48.3%, a difference of 0.090%), Immigrants from Singapore (48.3%, a difference of 0.10%), Canadian (48.2%, a difference of 0.10%), and Scotch-Irish (48.3%, a difference of 0.12%).
DemographicsRating | RankMarried-couple Households
Immigrants from South Eastern Asia
98.9
/100
|
#68
Exceptional
48.4%
Immigrants from China
98.9
/100
|
#69
Exceptional
48.4%
Immigrants from North America
98.9
/100
|
#70
Exceptional
48.4%
Laotians
98.8
/100
|
#71
Exceptional
48.4%
Scotch-Irish
98.6
/100
|
#72
Exceptional
48.3%
Immigrants from Singapore
98.6
/100
|
#73
Exceptional
48.3%
Immigrants from Romania
98.6
/100
|
#74
Exceptional
48.3%
Immigrants from England
98.4
/100
|
#75
Exceptional
48.2%
Immigrants from Fiji
98.4
/100
|
#76
Exceptional
48.2%
Canadians
98.2
/100
|
#77
Exceptional
48.2%
Egyptians
98.2
/100
|
#78
Exceptional
48.2%
Immigrants from Netherlands
98.2
/100
|
#79
Exceptional
48.2%
Russians
98.1
/100
|
#80
Exceptional
48.2%
Finns
98.0
/100
|
#81
Exceptional
48.1%
Immigrants from Poland
97.7
/100
|
#82
Exceptional
48.1%

Immigrants from England Married-couple Households Correlation Summary

MeasurementImmigrants from England DataMarried-couple Households Data
Minimum0.098%21.3%
Maximum75.4%100.0%
Range75.3%78.7%
Mean10.0%56.2%
Median6.3%53.4%
Interquartile 25% (IQ1)3.1%49.8%
Interquartile 75% (IQ3)10.9%64.2%
Interquartile Range (IQR)7.8%14.4%
Standard Deviation (Sample)13.7%15.2%
Standard Deviation (Population)13.5%15.0%

Correlation Details

Immigrants from England PercentileSample SizeMarried-couple Households
[
0.0%
-
0.5%
]
0.098%
347,271,84746.1%
[
0.0%
-
0.5%
]
0.38%
34,762,07151.1%
[
0.5%
-
1.0%
]
0.68%
6,502,70651.4%
[
0.5%
-
1.0%
]
0.97%
1,740,01652.6%
[
1.0%
-
1.5%
]
1.23%
707,62550.7%
[
1.5%
-
2.0%
]
1.53%
306,74254.0%
[
1.5%
-
2.0%
]
1.82%
147,13350.8%
[
2.0%
-
2.5%
]
2.11%
69,03049.5%
[
2.0%
-
2.5%
]
2.36%
59,21353.4%
[
2.5%
-
3.0%
]
2.66%
31,68852.7%
[
2.5%
-
3.0%
]
2.98%
35,87747.7%
[
3.0%
-
3.5%
]
3.23%
22,79953.4%
[
3.0%
-
3.5%
]
3.50%
13,00153.6%
[
3.5%
-
4.0%
]
3.87%
6,84364.8%
[
4.0%
-
4.5%
]
4.08%
9,31653.2%
[
4.0%
-
4.5%
]
4.31%
18,29762.4%
[
4.5%
-
5.0%
]
4.66%
17,87858.5%
[
4.5%
-
5.0%
]
4.93%
9,17150.8%
[
5.0%
-
5.5%
]
5.21%
4,04947.0%
[
5.5%
-
6.0%
]
5.57%
4,04158.7%
[
5.5%
-
6.0%
]
5.70%
2,68567.7%
[
6.0%
-
6.5%
]
6.06%
1,28750.1%
[
6.0%
-
6.5%
]
6.31%
63441.9%
[
6.5%
-
7.0%
]
6.73%
59460.4%
[
6.5%
-
7.0%
]
6.97%
1,21947.7%
[
7.0%
-
7.5%
]
7.19%
13987.3%
[
7.5%
-
8.0%
]
7.54%
49121.3%
[
7.5%
-
8.0%
]
7.71%
38950.2%
[
8.0%
-
8.5%
]
8.08%
58256.8%
[
8.0%
-
8.5%
]
8.41%
34566.9%
[
8.5%
-
9.0%
]
8.78%
46780.4%
[
9.0%
-
9.5%
]
9.26%
99351.6%
[
9.0%
-
9.5%
]
9.41%
87171.8%
[
10.0%
-
10.5%
]
10.20%
46154.7%
[
11.5%
-
12.0%
]
11.54%
15663.6%
[
12.5%
-
13.0%
]
12.71%
29129.4%
[
13.0%
-
13.5%
]
13.03%
23861.7%
[
14.0%
-
14.5%
]
14.36%
18830.3%
[
16.0%
-
16.5%
]
16.04%
63672.8%
[
16.5%
-
17.0%
]
16.98%
10670.5%
[
18.0%
-
18.5%
]
18.42%
3842.9%
[
20.0%
-
20.5%
]
20.39%
15279.6%
[
28.0%
-
28.5%
]
28.41%
8828.6%
[
56.0%
-
56.5%
]
56.39%
32178.4%
[
75.0%
-
75.5%
]
75.42%
240100.0%