Immigrants from England 4 or more Vehicles in Household

COMPARE

Immigrants from England
Race
Ancestry
AfghanAfricanAlaska NativeAlaskan AthabascanAlbanianAleutAlsatianAmericanApacheArabArapahoArgentineanArmenianAssyrian/Chaldean/SyriacAustralianAustrianBahamianBangladeshiBarbadianBasqueBelgianBelizeanBermudanBhutaneseBlackfeetBolivianBrazilianBritishBritish West IndianBulgarianBurmeseCajunCambodianCanadianCape VerdeanCarpatho RusynCelticCentral AmericanCentral American IndianCherokeeCheyenneChickasawChileanChineseChippewaChoctawColombianColvilleComancheCosta RicanCreeCreekCroatianCrowCubanCypriotCzechCzechoslovakianDanishDelawareDominicanDutchDutch West IndianEastern EuropeanEcuadorianEgyptianEnglishEstonianEthiopianEuropeanFijianFilipinoFinnishFrenchFrench American IndianFrench CanadianGermanGerman RussianGhanaianGreekGuamanian/ChamorroGuatemalanGuyaneseHaitianHmongHonduranHopiHoumaHungarianIcelanderIndian (Asian)IndonesianInupiatIranianIraqiIrishIroquoisIsraeliItalianJamaicanJapaneseJordanianKenyanKiowaKoreanLaotianLatvianLebaneseLiberianLithuanianLumbeeLuxembourgerMacedonianMalaysianMalteseMarshalleseMenomineeMexicanMexican American IndianMongolianMoroccanNative HawaiianNavajoNepaleseNew ZealanderNicaraguanNigerianNorthern EuropeanNorwegianOkinawanOsageOttawaPaiutePakistaniPalestinianPanamanianParaguayanPennsylvania GermanPeruvianPimaPolishPortuguesePotawatomiPuebloPuerto RicanPuget Sound SalishRomanianRussianSalvadoranSamoanScandinavianScotch-IrishScottishSeminoleSenegaleseSerbianShoshoneSierra LeoneanSiouxSlavicSlovakSloveneSomaliSouth AfricanSouth AmericanSouth American IndianSoviet UnionSpaniardSpanishSpanish AmericanSpanish American IndianSri LankanSubsaharan AfricanSudaneseSwedishSwissSyrianTaiwaneseThaiTlingit-HaidaTohono O'OdhamTonganTrinidadian and TobagonianTsimshianTurkishU.S. Virgin IslanderUgandanUkrainianUruguayanUteVenezuelanVietnameseWelshWest IndianYakamaYaquiYugoslavianYumanYup'ikZimbabwean
Immigration
NonimmigrantsImmigrantsAfghanistanAfricaAlbaniaArgentinaArmeniaAsiaAustraliaAustriaBahamasBangladeshBarbadosBelarusBelgiumBelizeBoliviaBosnia and HerzegovinaBrazilBulgariaBurma/MyanmarCabo VerdeCambodiaCameroonCanadaCaribbeanCentral AmericaChileChinaColombiaCongoCosta RicaCroatiaCubaCzechoslovakiaDenmarkDominicaDominican RepublicEastern AfricaEastern AsiaEastern EuropeEcuadorEgyptEl SalvadorEnglandEritreaEthiopiaEuropeFijiFranceGermanyGhanaGreeceGrenadaGuatemalaGuyanaHaitiHondurasHong KongHungaryIndiaIndonesiaIranIraqIrelandIsraelItalyJamaicaJapanJordanKazakhstanKenyaKoreaKuwaitLaosLatin AmericaLatviaLebanonLiberiaLithuaniaMalaysiaMexicoMicronesiaMiddle AfricaMoldovaMoroccoNepalNetherlandsNicaraguaNigeriaNorth AmericaNorth MacedoniaNorthern AfricaNorthern EuropeNorwayOceaniaPakistanPanamaPeruPhilippinesPolandPortugalRomaniaRussiaSaudi ArabiaScotlandSenegalSerbiaSierra LeoneSingaporeSomaliaSouth AfricaSouth AmericaSouth Central AsiaSouth Eastern AsiaSouthern EuropeSpainSri LankaSt. Vincent and the GrenadinesSudanSwedenSwitzerlandSyriaTaiwanThailandTrinidad and TobagoTurkeyUgandaUkraineUruguayUzbekistanVenezuelaVietnamWest IndiesWestern AfricaWestern AsiaWestern EuropeYemenZaireZimbabweAzores
Select to Compare
Race
Ancestry
AfghanAfricanAlaska NativeAlaskan AthabascanAlbanianAleutAlsatianAmericanApacheArabArapahoArgentineanArmenianAssyrian/Chaldean/SyriacAustralianAustrianBahamianBangladeshiBarbadianBasqueBelgianBelizeanBermudanBhutaneseBlackfeetBolivianBrazilianBritishBritish West IndianBulgarianBurmeseCajunCambodianCanadianCape VerdeanCarpatho RusynCelticCentral AmericanCentral American IndianCherokeeCheyenneChickasawChileanChineseChippewaChoctawColombianColvilleComancheCosta RicanCreeCreekCroatianCrowCubanCypriotCzechCzechoslovakianDanishDelawareDominicanDutchDutch West IndianEastern EuropeanEcuadorianEgyptianEnglishEstonianEthiopianEuropeanFijianFilipinoFinnishFrenchFrench American IndianFrench CanadianGermanGerman RussianGhanaianGreekGuamanian/ChamorroGuatemalanGuyaneseHaitianHmongHonduranHopiHoumaHungarianIcelanderIndian (Asian)IndonesianInupiatIranianIraqiIrishIroquoisIsraeliItalianJamaicanJapaneseJordanianKenyanKiowaKoreanLaotianLatvianLebaneseLiberianLithuanianLumbeeLuxembourgerMacedonianMalaysianMalteseMarshalleseMenomineeMexicanMexican American IndianMongolianMoroccanNative HawaiianNavajoNepaleseNew ZealanderNicaraguanNigerianNorthern EuropeanNorwegianOkinawanOsageOttawaPaiutePakistaniPalestinianPanamanianParaguayanPennsylvania GermanPeruvianPimaPolishPortuguesePotawatomiPuebloPuerto RicanPuget Sound SalishRomanianRussianSalvadoranSamoanScandinavianScotch-IrishScottishSeminoleSenegaleseSerbianShoshoneSierra LeoneanSiouxSlavicSlovakSloveneSomaliSouth AfricanSouth AmericanSouth American IndianSoviet UnionSpaniardSpanishSpanish AmericanSpanish American IndianSri LankanSubsaharan AfricanSudaneseSwedishSwissSyrianTaiwaneseThaiTlingit-HaidaTohono O'OdhamTonganTrinidadian and TobagonianTsimshianTurkishU.S. Virgin IslanderUgandanUkrainianUruguayanUteVenezuelanVietnameseWelshWest IndianYakamaYaquiYugoslavianYumanYup'ikZimbabwean
Immigration
NonimmigrantsImmigrantsAfghanistanAfricaAlbaniaArgentinaArmeniaAsiaAustraliaAustriaBahamasBangladeshBarbadosBelarusBelgiumBelizeBoliviaBosnia and HerzegovinaBrazilBulgariaBurma/MyanmarCabo VerdeCambodiaCameroonCanadaCaribbeanCentral AmericaChileChinaColombiaCongoCosta RicaCroatiaCubaCzechoslovakiaDenmarkDominicaDominican RepublicEastern AfricaEastern AsiaEastern EuropeEcuadorEgyptEl SalvadorEritreaEthiopiaEuropeFijiFranceGermanyGhanaGreeceGrenadaGuatemalaGuyanaHaitiHondurasHong KongHungaryIndiaIndonesiaIranIraqIrelandIsraelItalyJamaicaJapanJordanKazakhstanKenyaKoreaKuwaitLaosLatin AmericaLatviaLebanonLiberiaLithuaniaMalaysiaMexicoMicronesiaMiddle AfricaMoldovaMoroccoNepalNetherlandsNicaraguaNigeriaNorth AmericaNorth MacedoniaNorthern AfricaNorthern EuropeNorwayOceaniaPakistanPanamaPeruPhilippinesPolandPortugalRomaniaRussiaSaudi ArabiaScotlandSenegalSerbiaSierra LeoneSingaporeSomaliaSouth AfricaSouth AmericaSouth Central AsiaSouth Eastern AsiaSouthern EuropeSpainSri LankaSt. Vincent and the GrenadinesSudanSwedenSwitzerlandSyriaTaiwanThailandTrinidad and TobagoTurkeyUgandaUkraineUruguayUzbekistanVenezuelaVietnamWest IndiesWestern AfricaWestern AsiaWestern EuropeYemenZaireZimbabweAzores
4 or more Vehicles in Household
Income
Poverty
Unemployment
Labor Participation
Family Structure
Vehicle Availability
Education Level
Disability

Immigrants from England 4 or more Vehicles in Household
Exceptional

6.7%
4+ VEHICLES AVAILABLE
92.0/ 100
METRIC RATING
129th/ 347
METRIC RANK

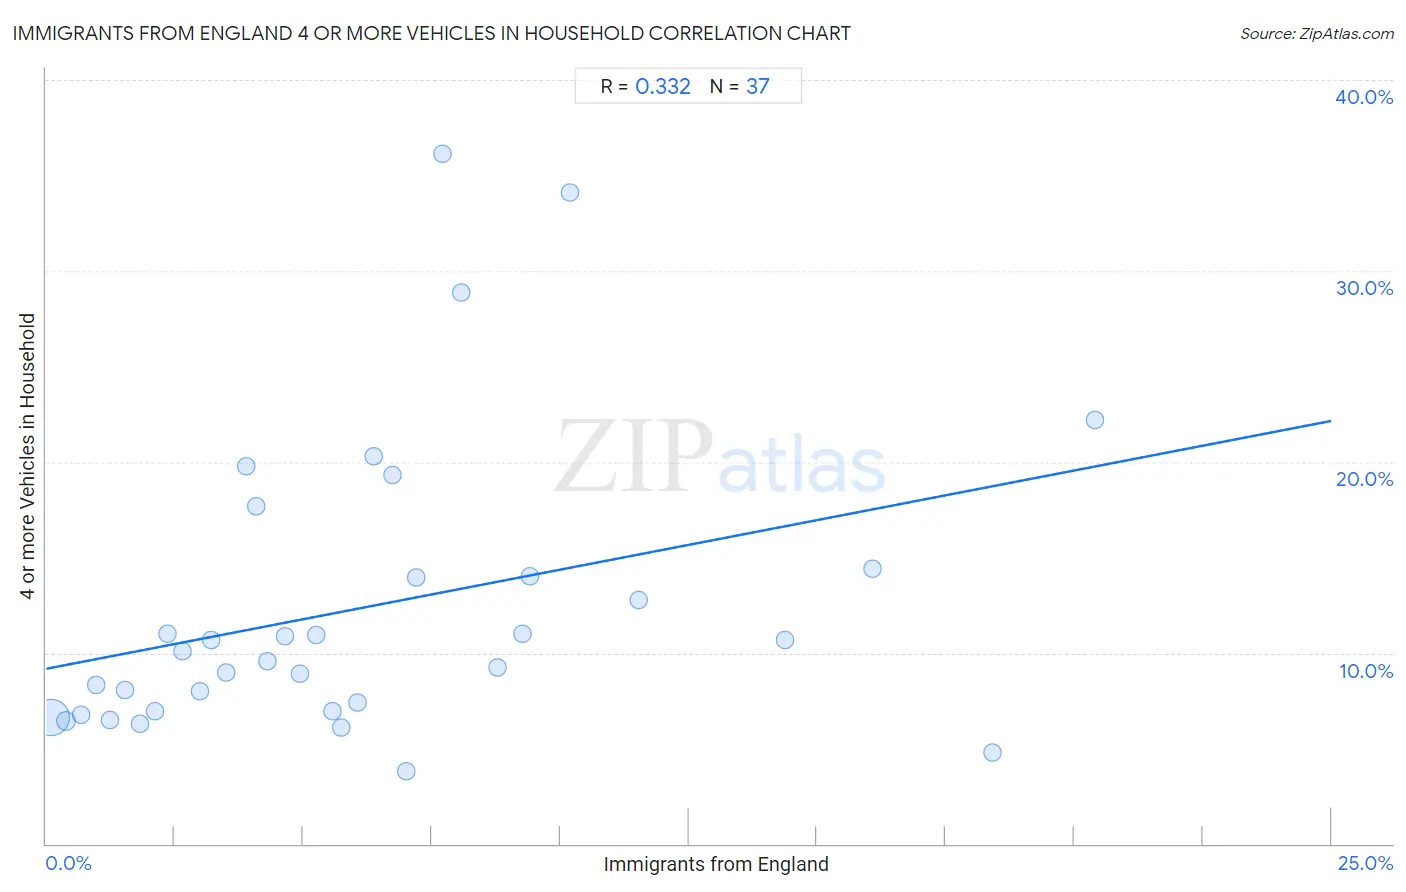
Immigrants from England 4 or more Vehicles in Household Correlation Chart

The statistical analysis conducted on geographies consisting of 390,499,867 people shows a mild positive correlation between the proportion of Immigrants from England and percentage of households with 4 or more vehicles available in the United States with a correlation coefficient (R) of 0.332 and weighted average of 6.7%. On average, for every 1% (one percent) increase in Immigrants from England within a typical geography, there is an increase of 0.52% in percentage of households with 4 or more vehicles available.
Immigrants from England 4 or more Vehicles in Household
It is essential to understand that the correlation between the percentage of Immigrants from England and percentage of households with 4 or more vehicles available does not imply a direct cause-and-effect relationship. It remains uncertain whether the presence of Immigrants from England influences an upward or downward trend in the level of percentage of households with 4 or more vehicles available within an area, or if Immigrants from England simply ended up residing in those areas with higher or lower levels of percentage of households with 4 or more vehicles available due to other factors.

Demographics Similar to Immigrants from England by 4 or more Vehicles in Household

In terms of 4 or more vehicles in household, the demographic groups most similar to Immigrants from England are Immigrants from Bolivia (6.7%, a difference of 0.16%), Immigrants from Korea (6.8%, a difference of 0.66%), Austrian (6.8%, a difference of 0.79%), Belgian (6.8%, a difference of 0.79%), and Immigrants from Scotland (6.7%, a difference of 0.83%).
DemographicsRating | Rank4 or more Vehicles in Household
Immigrants from Nicaragua
94.7
/100
|
#122
Exceptional
6.8%
Immigrants
94.6
/100
|
#123
Exceptional
6.8%
Immigrants from Asia
94.4
/100
|
#124
Exceptional
6.8%
Austrians
94.1
/100
|
#125
Exceptional
6.8%
Belgians
94.1
/100
|
#126
Exceptional
6.8%
Immigrants from Korea
93.8
/100
|
#127
Exceptional
6.8%
Immigrants from Bolivia
92.5
/100
|
#128
Exceptional
6.7%
Immigrants from England
92.0
/100
|
#129
Exceptional
6.7%
Immigrants from Scotland
89.0
/100
|
#130
Excellent
6.7%
Maltese
88.4
/100
|
#131
Excellent
6.7%
Immigrants from Netherlands
87.8
/100
|
#132
Excellent
6.6%
Armenians
86.9
/100
|
#133
Excellent
6.6%
Ottawa
86.9
/100
|
#134
Excellent
6.6%
Tohono O'odham
86.7
/100
|
#135
Excellent
6.6%
Luxembourgers
86.4
/100
|
#136
Excellent
6.6%

Immigrants from England 4 or more Vehicles in Household Correlation Summary

MeasurementImmigrants from England Data4 or more Vehicles in Household Data
Minimum0.098%3.8%
Maximum20.4%36.2%
Range20.3%32.3%
Mean6.2%12.4%
Median5.2%10.1%
Interquartile 25% (IQ1)2.5%6.9%
Interquartile 75% (IQ3)8.4%14.2%
Interquartile Range (IQR)5.9%7.3%
Standard Deviation (Sample)4.9%7.7%
Standard Deviation (Population)4.9%7.6%

Correlation Details

Immigrants from England PercentileSample Size4 or more Vehicles in Household
[
0.0%
-
0.5%
]
0.098%
346,531,2066.6%
[
0.0%
-
0.5%
]
0.38%
34,458,6166.4%
[
0.5%
-
1.0%
]
0.67%
6,393,8566.8%
[
0.5%
-
1.0%
]
0.97%
1,712,4388.3%
[
1.0%
-
1.5%
]
1.23%
688,1846.5%
[
1.5%
-
2.0%
]
1.53%
283,3948.0%
[
1.5%
-
2.0%
]
1.82%
144,5736.3%
[
2.0%
-
2.5%
]
2.11%
61,9656.9%
[
2.0%
-
2.5%
]
2.36%
57,70511.0%
[
2.5%
-
3.0%
]
2.65%
27,68510.1%
[
2.5%
-
3.0%
]
2.98%
34,2838.0%
[
3.0%
-
3.5%
]
3.21%
20,38110.6%
[
3.5%
-
4.0%
]
3.50%
11,4198.9%
[
3.5%
-
4.0%
]
3.88%
6,25919.8%
[
4.0%
-
4.5%
]
4.08%
9,14317.7%
[
4.0%
-
4.5%
]
4.31%
17,9749.5%
[
4.5%
-
5.0%
]
4.65%
15,98910.9%
[
4.5%
-
5.0%
]
4.93%
9,4958.9%
[
5.0%
-
5.5%
]
5.24%
3,12910.9%
[
5.5%
-
6.0%
]
5.57%
4,0057.0%
[
5.5%
-
6.0%
]
5.73%
1,0296.1%
[
6.0%
-
6.5%
]
6.06%
9747.4%
[
6.0%
-
6.5%
]
6.37%
25120.3%
[
6.5%
-
7.0%
]
6.73%
59419.3%
[
6.5%
-
7.0%
]
6.99%
9013.8%
[
7.0%
-
7.5%
]
7.19%
13913.9%
[
7.5%
-
8.0%
]
7.71%
38936.2%
[
8.0%
-
8.5%
]
8.08%
58228.9%
[
8.5%
-
9.0%
]
8.78%
4679.2%
[
9.0%
-
9.5%
]
9.26%
99311.0%
[
9.0%
-
9.5%
]
9.42%
55214.0%
[
10.0%
-
10.5%
]
10.20%
40234.1%
[
11.5%
-
12.0%
]
11.54%
15612.8%
[
14.0%
-
14.5%
]
14.36%
18810.7%
[
16.0%
-
16.5%
]
16.07%
36114.4%
[
18.0%
-
18.5%
]
18.42%
384.8%
[
20.0%
-
20.5%
]
20.39%
15222.2%