Immigrants from Belize Married-Couple Family Poverty
COMPARE
Immigrants from Belize
Select to Compare
Married-Couple Family Poverty
Immigrants from Belize Married-Couple Family Poverty
6.7%
POVERTY | MARRIED-COUPLE FAMILIES
0.0/ 100
METRIC RATING
300th/ 347
METRIC RANK
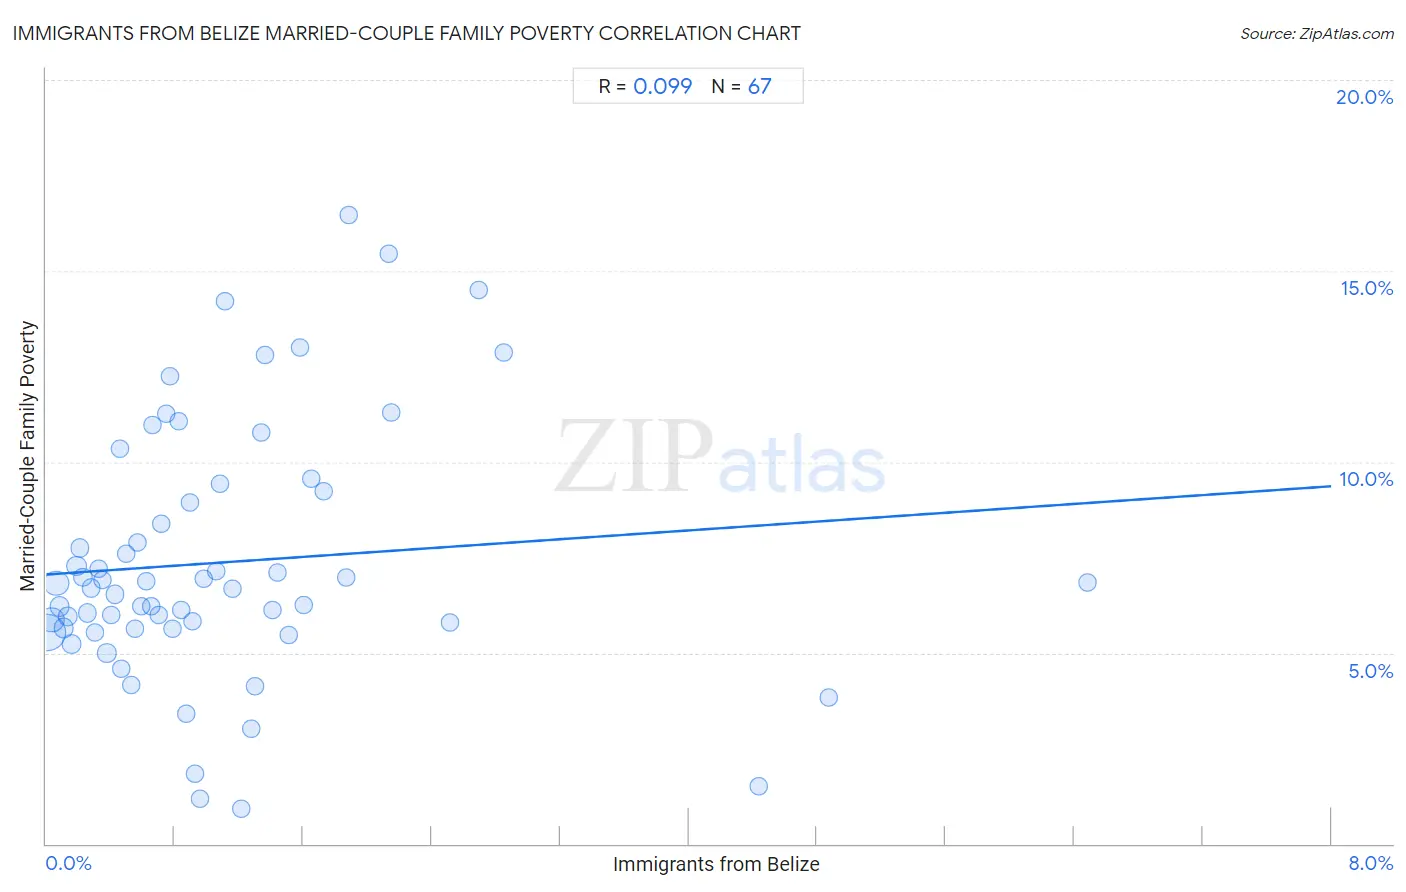
Immigrants from Belize Married-Couple Family Poverty Correlation Chart
The statistical analysis conducted on geographies consisting of 130,147,118 people shows a slight positive correlation between the proportion of Immigrants from Belize and poverty level among married-couple families in the United States with a correlation coefficient (R) of 0.099 and weighted average of 6.7%. On average, for every 1% (one percent) increase in Immigrants from Belize within a typical geography, there is an increase of 0.29% in poverty level among married-couple families.
It is essential to understand that the correlation between the percentage of Immigrants from Belize and poverty level among married-couple families does not imply a direct cause-and-effect relationship. It remains uncertain whether the presence of Immigrants from Belize influences an upward or downward trend in the level of poverty level among married-couple families within an area, or if Immigrants from Belize simply ended up residing in those areas with higher or lower levels of poverty level among married-couple families due to other factors.
Demographics Similar to Immigrants from Belize by Married-Couple Family Poverty
In terms of married-couple family poverty, the demographic groups most similar to Immigrants from Belize are Nicaraguan (6.7%, a difference of 0.15%), Central American (6.7%, a difference of 0.60%), Immigrants from Guyana (6.7%, a difference of 0.69%), Immigrants from Ecuador (6.7%, a difference of 0.74%), and Kiowa (6.6%, a difference of 0.76%).
| Demographics | Rating | Rank | Married-Couple Family Poverty |
| Arapaho | 0.0 /100 | #293 | Tragic 6.6% |
| Bahamians | 0.0 /100 | #294 | Tragic 6.6% |
| Immigrants from Uzbekistan | 0.0 /100 | #295 | Tragic 6.6% |
| U.S. Virgin Islanders | 0.0 /100 | #296 | Tragic 6.6% |
| Kiowa | 0.0 /100 | #297 | Tragic 6.6% |
| Immigrants from Guyana | 0.0 /100 | #298 | Tragic 6.7% |
| Nicaraguans | 0.0 /100 | #299 | Tragic 6.7% |
| Immigrants from Belize | 0.0 /100 | #300 | Tragic 6.7% |
| Central Americans | 0.0 /100 | #301 | Tragic 6.7% |
| Immigrants from Ecuador | 0.0 /100 | #302 | Tragic 6.7% |
| Immigrants from El Salvador | 0.0 /100 | #303 | Tragic 6.8% |
| Cubans | 0.0 /100 | #304 | Tragic 6.8% |
| Haitians | 0.0 /100 | #305 | Tragic 6.8% |
| Immigrants from Haiti | 0.0 /100 | #306 | Tragic 7.0% |
| Guatemalans | 0.0 /100 | #307 | Tragic 7.0% |
Immigrants from Belize Married-Couple Family Poverty Correlation Summary
| Measurement | Immigrants from Belize Data | Married-Couple Family Poverty Data |
| Minimum | 0.011% | 0.90% |
| Maximum | 6.5% | 16.5% |
| Range | 6.5% | 15.6% |
| Mean | 1.1% | 7.4% |
| Median | 0.82% | 6.7% |
| Interquartile 25% (IQ1) | 0.40% | 5.6% |
| Interquartile 75% (IQ3) | 1.4% | 9.2% |
| Interquartile Range (IQR) | 1.0% | 3.6% |
| Standard Deviation (Sample) | 1.1% | 3.3% |
| Standard Deviation (Population) | 1.1% | 3.3% |
Correlation Details
| Immigrants from Belize Percentile | Sample Size | Married-Couple Family Poverty |
[ 0.0% - 0.5% ] 0.011% | 58,255,151 | 5.5% |
[ 0.0% - 0.5% ] 0.035% | 20,381,526 | 5.9% |
[ 0.0% - 0.5% ] 0.065% | 22,674,001 | 6.8% |
[ 0.0% - 0.5% ] 0.083% | 6,310,489 | 6.2% |
[ 0.0% - 0.5% ] 0.11% | 4,547,363 | 5.7% |
[ 0.0% - 0.5% ] 0.13% | 2,578,952 | 6.0% |
[ 0.0% - 0.5% ] 0.16% | 2,157,932 | 5.2% |
[ 0.0% - 0.5% ] 0.19% | 5,795,240 | 7.3% |
[ 0.0% - 0.5% ] 0.21% | 924,855 | 7.7% |
[ 0.0% - 0.5% ] 0.23% | 1,443,199 | 7.0% |
[ 0.0% - 0.5% ] 0.26% | 784,121 | 6.0% |
[ 0.0% - 0.5% ] 0.28% | 566,456 | 6.7% |
[ 0.0% - 0.5% ] 0.30% | 327,497 | 5.5% |
[ 0.0% - 0.5% ] 0.33% | 209,681 | 7.2% |
[ 0.0% - 0.5% ] 0.35% | 316,593 | 6.9% |
[ 0.0% - 0.5% ] 0.38% | 282,813 | 5.0% |
[ 0.0% - 0.5% ] 0.40% | 196,890 | 6.0% |
[ 0.0% - 0.5% ] 0.43% | 220,464 | 6.5% |
[ 0.0% - 0.5% ] 0.46% | 204,607 | 10.4% |
[ 0.0% - 0.5% ] 0.47% | 24,715 | 4.6% |
[ 0.0% - 0.5% ] 0.50% | 139,661 | 7.6% |
[ 0.5% - 1.0% ] 0.53% | 131,825 | 4.1% |
[ 0.5% - 1.0% ] 0.55% | 136,051 | 5.6% |
[ 0.5% - 1.0% ] 0.57% | 141,791 | 7.9% |
[ 0.5% - 1.0% ] 0.60% | 1,176 | 6.2% |
[ 0.5% - 1.0% ] 0.62% | 165,594 | 6.9% |
[ 0.5% - 1.0% ] 0.65% | 93,547 | 6.2% |
[ 0.5% - 1.0% ] 0.66% | 1,063 | 11.0% |
[ 0.5% - 1.0% ] 0.70% | 27,353 | 6.0% |
[ 0.5% - 1.0% ] 0.72% | 59,159 | 8.4% |
[ 0.5% - 1.0% ] 0.74% | 30,784 | 11.3% |
[ 0.5% - 1.0% ] 0.77% | 42,343 | 12.2% |
[ 0.5% - 1.0% ] 0.79% | 59,697 | 5.6% |
[ 0.5% - 1.0% ] 0.82% | 78,806 | 11.1% |
[ 0.5% - 1.0% ] 0.84% | 89,435 | 6.1% |
[ 0.5% - 1.0% ] 0.87% | 11,824 | 3.4% |
[ 0.5% - 1.0% ] 0.89% | 116,370 | 8.9% |
[ 0.5% - 1.0% ] 0.91% | 55,750 | 5.8% |
[ 0.5% - 1.0% ] 0.93% | 42,990 | 1.8% |
[ 0.5% - 1.0% ] 0.95% | 5,765 | 1.2% |
[ 0.5% - 1.0% ] 0.98% | 6,710 | 7.0% |
[ 1.0% - 1.5% ] 1.06% | 110,279 | 7.1% |
[ 1.0% - 1.5% ] 1.08% | 4,807 | 9.4% |
[ 1.0% - 1.5% ] 1.11% | 69,064 | 14.2% |
[ 1.0% - 1.5% ] 1.16% | 47,309 | 6.7% |
[ 1.0% - 1.5% ] 1.21% | 5,200 | 0.90% |
[ 1.0% - 1.5% ] 1.28% | 2,739 | 3.0% |
[ 1.0% - 1.5% ] 1.30% | 13,698 | 4.1% |
[ 1.0% - 1.5% ] 1.34% | 13,456 | 10.8% |
[ 1.0% - 1.5% ] 1.36% | 15,380 | 12.8% |
[ 1.0% - 1.5% ] 1.41% | 11,453 | 6.1% |
[ 1.0% - 1.5% ] 1.44% | 14,679 | 7.1% |
[ 1.5% - 2.0% ] 1.51% | 861 | 5.5% |
[ 1.5% - 2.0% ] 1.58% | 49,898 | 13.0% |
[ 1.5% - 2.0% ] 1.60% | 8,225 | 6.2% |
[ 1.5% - 2.0% ] 1.65% | 15,132 | 9.5% |
[ 1.5% - 2.0% ] 1.73% | 29,307 | 9.2% |
[ 1.5% - 2.0% ] 1.87% | 44,461 | 7.0% |
[ 1.5% - 2.0% ] 1.88% | 1,489 | 16.5% |
[ 2.0% - 2.5% ] 2.13% | 2,582 | 15.5% |
[ 2.0% - 2.5% ] 2.15% | 8,134 | 11.3% |
[ 2.5% - 3.0% ] 2.51% | 33,528 | 5.8% |
[ 2.5% - 3.0% ] 2.70% | 408 | 14.5% |
[ 2.5% - 3.0% ] 2.85% | 1,932 | 12.9% |
[ 4.0% - 4.5% ] 4.44% | 834 | 1.5% |
[ 4.5% - 5.0% ] 4.87% | 1,129 | 3.8% |
[ 6.0% - 6.5% ] 6.48% | 895 | 6.8% |