Immigrants from Belize Disability Age Under 5
COMPARE
Immigrants from Belize
Select to Compare
Disability Age Under 5
Immigrants from Belize Disability Age Under 5
1.1%
DISABILITY | AGE UNDER 5
98.7/ 100
METRIC RATING
67th/ 347
METRIC RANK
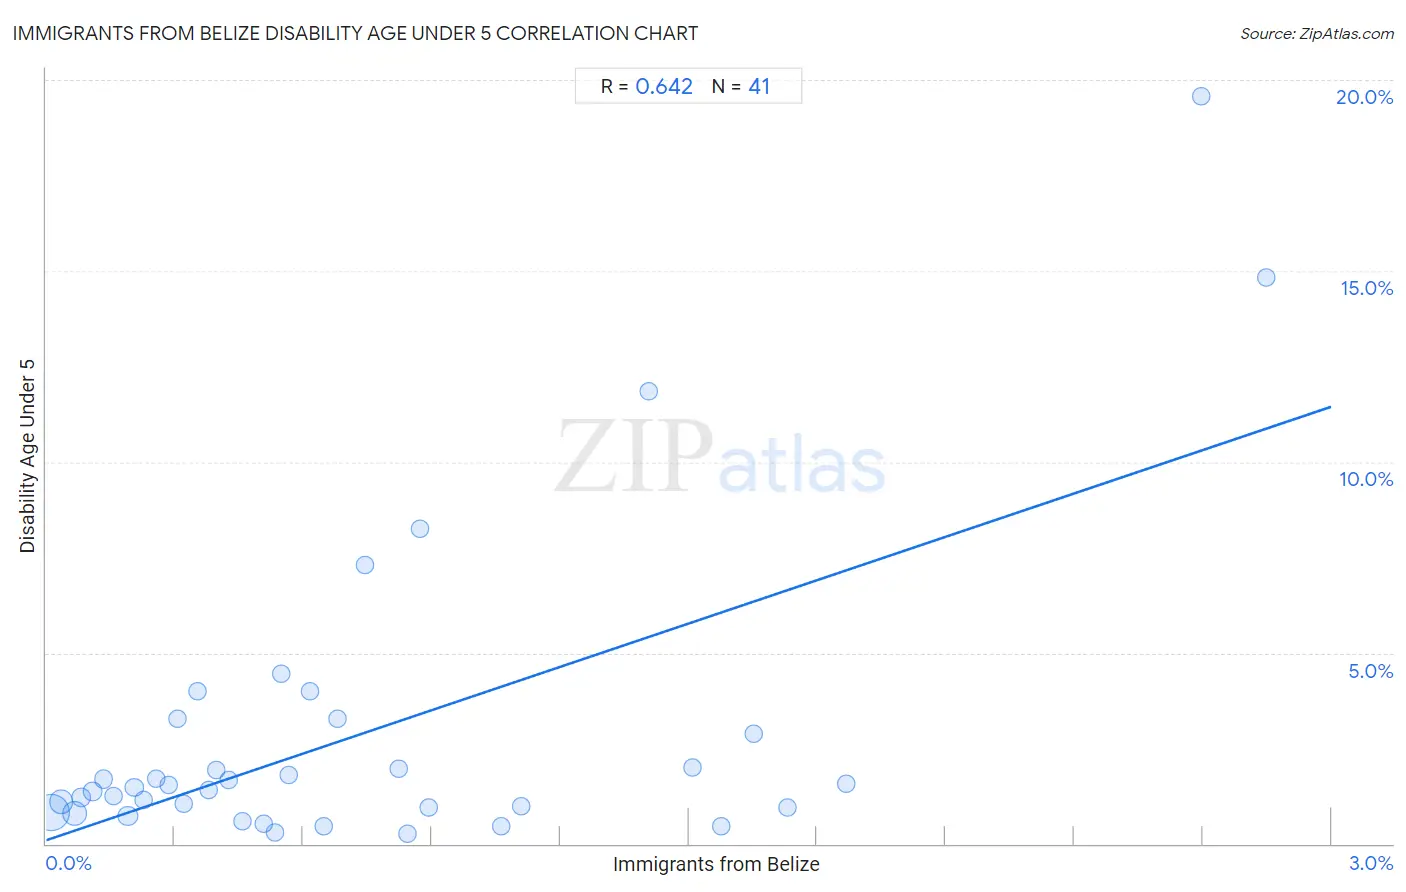
Immigrants from Belize Disability Age Under 5 Correlation Chart
The statistical analysis conducted on geographies consisting of 95,414,478 people shows a significant positive correlation between the proportion of Immigrants from Belize and percentage of population with a disability under the age of 5 in the United States with a correlation coefficient (R) of 0.642 and weighted average of 1.1%. On average, for every 1% (one percent) increase in Immigrants from Belize within a typical geography, there is an increase of 3.8% in percentage of population with a disability under the age of 5.
It is essential to understand that the correlation between the percentage of Immigrants from Belize and percentage of population with a disability under the age of 5 does not imply a direct cause-and-effect relationship. It remains uncertain whether the presence of Immigrants from Belize influences an upward or downward trend in the level of percentage of population with a disability under the age of 5 within an area, or if Immigrants from Belize simply ended up residing in those areas with higher or lower levels of percentage of population with a disability under the age of 5 due to other factors.
Demographics Similar to Immigrants from Belize by Disability Age Under 5
In terms of disability age under 5, the demographic groups most similar to Immigrants from Belize are South African (1.1%, a difference of 0.040%), Israeli (1.1%, a difference of 0.060%), Immigrants from Indonesia (1.1%, a difference of 0.070%), Immigrants from Ecuador (1.1%, a difference of 0.15%), and Immigrants from Korea (1.1%, a difference of 0.19%).
| Demographics | Rating | Rank | Disability Age Under 5 |
| Immigrants from Western Asia | 99.2 /100 | #60 | Exceptional 1.1% |
| Immigrants from Ethiopia | 99.2 /100 | #61 | Exceptional 1.1% |
| Immigrants from Switzerland | 99.2 /100 | #62 | Exceptional 1.1% |
| Immigrants from Vietnam | 99.1 /100 | #63 | Exceptional 1.1% |
| Egyptians | 98.9 /100 | #64 | Exceptional 1.1% |
| Immigrants from Korea | 98.8 /100 | #65 | Exceptional 1.1% |
| Immigrants from Indonesia | 98.7 /100 | #66 | Exceptional 1.1% |
| Immigrants from Belize | 98.7 /100 | #67 | Exceptional 1.1% |
| South Africans | 98.7 /100 | #68 | Exceptional 1.1% |
| Israelis | 98.7 /100 | #69 | Exceptional 1.1% |
| Immigrants from Ecuador | 98.6 /100 | #70 | Exceptional 1.1% |
| Trinidadians and Tobagonians | 98.6 /100 | #71 | Exceptional 1.1% |
| Burmese | 98.5 /100 | #72 | Exceptional 1.1% |
| Immigrants from Sri Lanka | 98.5 /100 | #73 | Exceptional 1.1% |
| Jordanians | 98.5 /100 | #74 | Exceptional 1.1% |
Immigrants from Belize Disability Age Under 5 Correlation Summary
| Measurement | Immigrants from Belize Data | Disability Age Under 5 Data |
| Minimum | 0.010% | 0.27% |
| Maximum | 2.8% | 19.6% |
| Range | 2.8% | 19.3% |
| Mean | 0.74% | 2.9% |
| Median | 0.53% | 1.5% |
| Interquartile 25% (IQ1) | 0.24% | 0.89% |
| Interquartile 75% (IQ3) | 0.98% | 3.1% |
| Interquartile Range (IQR) | 0.73% | 2.2% |
| Standard Deviation (Sample) | 0.69% | 4.0% |
| Standard Deviation (Population) | 0.68% | 4.0% |
Correlation Details
| Immigrants from Belize Percentile | Sample Size | Disability Age Under 5 |
[ 0.0% - 0.5% ] 0.010% | 48,481,338 | 0.82% |
[ 0.0% - 0.5% ] 0.034% | 13,268,196 | 1.1% |
[ 0.0% - 0.5% ] 0.067% | 17,911,317 | 0.79% |
[ 0.0% - 0.5% ] 0.082% | 3,637,456 | 1.2% |
[ 0.0% - 0.5% ] 0.11% | 2,433,296 | 1.4% |
[ 0.0% - 0.5% ] 0.13% | 1,125,825 | 1.7% |
[ 0.0% - 0.5% ] 0.16% | 937,471 | 1.3% |
[ 0.0% - 0.5% ] 0.19% | 4,603,131 | 0.73% |
[ 0.0% - 0.5% ] 0.21% | 333,325 | 1.5% |
[ 0.0% - 0.5% ] 0.23% | 667,892 | 1.1% |
[ 0.0% - 0.5% ] 0.26% | 283,136 | 1.7% |
[ 0.0% - 0.5% ] 0.29% | 175,428 | 1.5% |
[ 0.0% - 0.5% ] 0.31% | 93,019 | 3.3% |
[ 0.0% - 0.5% ] 0.32% | 46,002 | 1.0% |
[ 0.0% - 0.5% ] 0.35% | 23,150 | 4.0% |
[ 0.0% - 0.5% ] 0.38% | 103,092 | 1.4% |
[ 0.0% - 0.5% ] 0.40% | 30,450 | 1.9% |
[ 0.0% - 0.5% ] 0.43% | 126,192 | 1.7% |
[ 0.0% - 0.5% ] 0.46% | 127,636 | 0.60% |
[ 0.5% - 1.0% ] 0.51% | 26,189 | 0.53% |
[ 0.5% - 1.0% ] 0.53% | 107,007 | 0.28% |
[ 0.5% - 1.0% ] 0.55% | 52,893 | 4.5% |
[ 0.5% - 1.0% ] 0.57% | 129,765 | 1.8% |
[ 0.5% - 1.0% ] 0.61% | 44,743 | 4.0% |
[ 0.5% - 1.0% ] 0.65% | 33,170 | 0.45% |
[ 0.5% - 1.0% ] 0.68% | 2,204 | 3.3% |
[ 0.5% - 1.0% ] 0.74% | 20,284 | 7.3% |
[ 0.5% - 1.0% ] 0.82% | 75,024 | 2.0% |
[ 0.5% - 1.0% ] 0.84% | 89,435 | 0.27% |
[ 0.5% - 1.0% ] 0.87% | 9,183 | 8.2% |
[ 0.5% - 1.0% ] 0.89% | 106,806 | 0.95% |
[ 1.0% - 1.5% ] 1.06% | 87,907 | 0.47% |
[ 1.0% - 1.5% ] 1.11% | 69,064 | 0.97% |
[ 1.0% - 1.5% ] 1.41% | 11,453 | 11.9% |
[ 1.5% - 2.0% ] 1.51% | 861 | 2.0% |
[ 1.5% - 2.0% ] 1.58% | 49,898 | 0.45% |
[ 1.5% - 2.0% ] 1.65% | 15,132 | 2.9% |
[ 1.5% - 2.0% ] 1.73% | 29,307 | 0.95% |
[ 1.5% - 2.0% ] 1.87% | 44,461 | 1.6% |
[ 2.5% - 3.0% ] 2.70% | 408 | 19.6% |
[ 2.5% - 3.0% ] 2.85% | 1,932 | 14.8% |