Immigrants from Belize Married-couple Households
COMPARE
Immigrants from Belize
Select to Compare
Married-couple Households
Immigrants from Belize Married-couple Households
41.8%
MARRIED-COUPLE HOUSEHOLDS
0.0/ 100
METRIC RATING
300th/ 347
METRIC RANK
Immigrants from Belize Married-couple Households Correlation Chart
The statistical analysis conducted on geographies consisting of 130,286,340 people shows a moderate positive correlation between the proportion of Immigrants from Belize and percentage of married-couple family households in the United States with a correlation coefficient (R) of 0.406 and weighted average of 41.8%. On average, for every 1% (one percent) increase in Immigrants from Belize within a typical geography, there is an increase of 3.8% in percentage of married-couple family households.
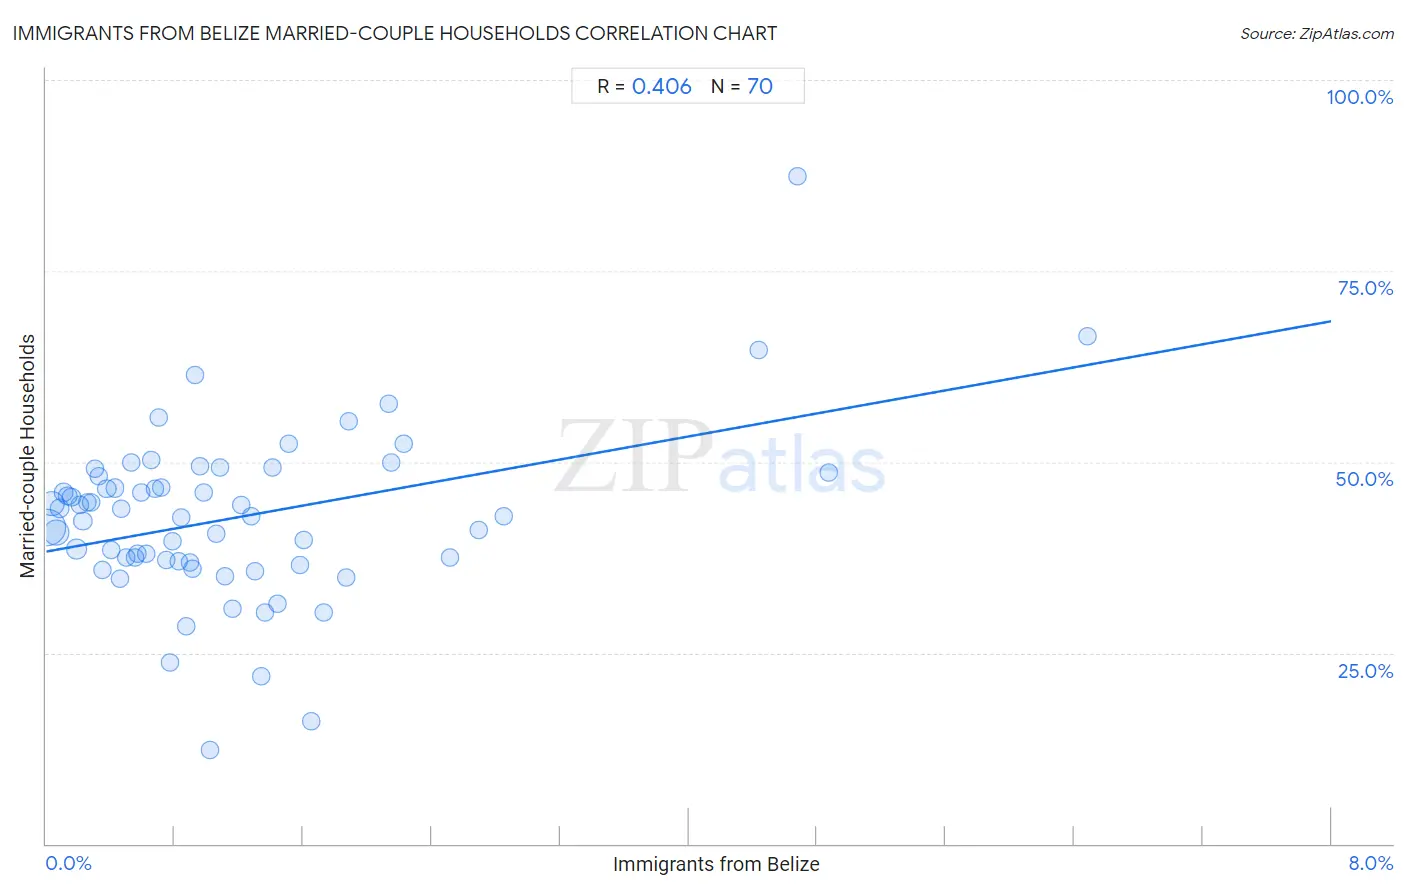
It is essential to understand that the correlation between the percentage of Immigrants from Belize and percentage of married-couple family households does not imply a direct cause-and-effect relationship. It remains uncertain whether the presence of Immigrants from Belize influences an upward or downward trend in the level of percentage of married-couple family households within an area, or if Immigrants from Belize simply ended up residing in those areas with higher or lower levels of percentage of married-couple family households due to other factors.
Demographics Similar to Immigrants from Belize by Married-couple Households
In terms of married-couple households, the demographic groups most similar to Immigrants from Belize are Immigrants from Ghana (41.8%, a difference of 0.020%), Immigrants from Middle Africa (41.8%, a difference of 0.090%), Arapaho (41.8%, a difference of 0.13%), Immigrants from Bahamas (41.7%, a difference of 0.21%), and Immigrants from Honduras (41.6%, a difference of 0.38%).
| Demographics | Rating | Rank | Married-couple Households |
| Menominee | 0.0 /100 | #293 | Tragic 42.0% |
| Immigrants from Yemen | 0.0 /100 | #294 | Tragic 42.0% |
| Kiowa | 0.0 /100 | #295 | Tragic 42.0% |
| Immigrants from Sudan | 0.0 /100 | #296 | Tragic 41.9% |
| Arapaho | 0.0 /100 | #297 | Tragic 41.8% |
| Immigrants from Middle Africa | 0.0 /100 | #298 | Tragic 41.8% |
| Immigrants from Ghana | 0.0 /100 | #299 | Tragic 41.8% |
| Immigrants from Belize | 0.0 /100 | #300 | Tragic 41.8% |
| Immigrants from Bahamas | 0.0 /100 | #301 | Tragic 41.7% |
| Immigrants from Honduras | 0.0 /100 | #302 | Tragic 41.6% |
| Sub-Saharan Africans | 0.0 /100 | #303 | Tragic 41.6% |
| Immigrants from Guyana | 0.0 /100 | #304 | Tragic 41.6% |
| Sioux | 0.0 /100 | #305 | Tragic 41.5% |
| Guyanese | 0.0 /100 | #306 | Tragic 41.4% |
| Immigrants from Western Africa | 0.0 /100 | #307 | Tragic 41.4% |
Immigrants from Belize Married-couple Households Correlation Summary
| Measurement | Immigrants from Belize Data | Married-couple Households Data |
| Minimum | 0.011% | 12.3% |
| Maximum | 6.5% | 87.4% |
| Range | 6.5% | 75.1% |
| Mean | 1.2% | 42.7% |
| Median | 0.86% | 42.9% |
| Interquartile 25% (IQ1) | 0.43% | 37.0% |
| Interquartile 75% (IQ3) | 1.4% | 48.1% |
| Interquartile Range (IQR) | 1.0% | 11.1% |
| Standard Deviation (Sample) | 1.2% | 11.1% |
| Standard Deviation (Population) | 1.2% | 11.0% |
Correlation Details
| Immigrants from Belize Percentile | Sample Size | Married-couple Households |
[ 0.0% - 0.5% ] 0.011% | 58,255,151 | 41.5% |
[ 0.0% - 0.5% ] 0.035% | 20,402,607 | 44.5% |
[ 0.0% - 0.5% ] 0.065% | 22,703,402 | 40.8% |
[ 0.0% - 0.5% ] 0.083% | 6,310,489 | 43.9% |
[ 0.0% - 0.5% ] 0.11% | 4,556,487 | 46.0% |
[ 0.0% - 0.5% ] 0.13% | 2,585,215 | 45.6% |
[ 0.0% - 0.5% ] 0.16% | 2,157,932 | 45.4% |
[ 0.0% - 0.5% ] 0.19% | 5,795,240 | 38.6% |
[ 0.0% - 0.5% ] 0.21% | 924,855 | 44.4% |
[ 0.0% - 0.5% ] 0.23% | 1,458,905 | 42.3% |
[ 0.0% - 0.5% ] 0.26% | 784,121 | 44.7% |
[ 0.0% - 0.5% ] 0.28% | 572,760 | 44.7% |
[ 0.0% - 0.5% ] 0.30% | 327,497 | 49.1% |
[ 0.0% - 0.5% ] 0.33% | 209,681 | 48.1% |
[ 0.0% - 0.5% ] 0.35% | 321,582 | 35.9% |
[ 0.0% - 0.5% ] 0.38% | 285,795 | 46.5% |
[ 0.0% - 0.5% ] 0.40% | 197,134 | 38.4% |
[ 0.0% - 0.5% ] 0.43% | 220,464 | 46.6% |
[ 0.0% - 0.5% ] 0.46% | 204,607 | 34.8% |
[ 0.0% - 0.5% ] 0.47% | 24,715 | 43.9% |
[ 0.0% - 0.5% ] 0.50% | 140,660 | 37.4% |
[ 0.5% - 1.0% ] 0.53% | 135,291 | 50.0% |
[ 0.5% - 1.0% ] 0.55% | 144,361 | 37.5% |
[ 0.5% - 1.0% ] 0.57% | 141,964 | 38.0% |
[ 0.5% - 1.0% ] 0.60% | 1,176 | 46.0% |
[ 0.5% - 1.0% ] 0.62% | 165,594 | 37.9% |
[ 0.5% - 1.0% ] 0.65% | 93,547 | 50.3% |
[ 0.5% - 1.0% ] 0.67% | 3,267 | 46.5% |
[ 0.5% - 1.0% ] 0.70% | 27,353 | 55.9% |
[ 0.5% - 1.0% ] 0.72% | 59,159 | 46.7% |
[ 0.5% - 1.0% ] 0.74% | 30,784 | 37.2% |
[ 0.5% - 1.0% ] 0.77% | 42,343 | 23.7% |
[ 0.5% - 1.0% ] 0.79% | 59,697 | 39.7% |
[ 0.5% - 1.0% ] 0.82% | 78,930 | 37.0% |
[ 0.5% - 1.0% ] 0.84% | 89,435 | 42.7% |
[ 0.5% - 1.0% ] 0.87% | 11,824 | 28.5% |
[ 0.5% - 1.0% ] 0.89% | 117,043 | 36.8% |
[ 0.5% - 1.0% ] 0.91% | 66,333 | 36.0% |
[ 0.5% - 1.0% ] 0.93% | 42,990 | 61.4% |
[ 0.5% - 1.0% ] 0.95% | 5,765 | 49.5% |
[ 0.5% - 1.0% ] 0.98% | 6,710 | 46.0% |
[ 1.0% - 1.5% ] 1.02% | 1,278 | 12.3% |
[ 1.0% - 1.5% ] 1.06% | 110,279 | 40.6% |
[ 1.0% - 1.5% ] 1.08% | 7,585 | 49.3% |
[ 1.0% - 1.5% ] 1.11% | 69,064 | 35.0% |
[ 1.0% - 1.5% ] 1.16% | 47,309 | 30.8% |
[ 1.0% - 1.5% ] 1.21% | 5,200 | 44.3% |
[ 1.0% - 1.5% ] 1.27% | 13,022 | 42.9% |
[ 1.0% - 1.5% ] 1.30% | 13,698 | 35.6% |
[ 1.0% - 1.5% ] 1.34% | 13,910 | 22.0% |
[ 1.0% - 1.5% ] 1.36% | 15,380 | 30.3% |
[ 1.0% - 1.5% ] 1.41% | 11,453 | 49.3% |
[ 1.0% - 1.5% ] 1.44% | 14,679 | 31.5% |
[ 1.5% - 2.0% ] 1.51% | 861 | 52.4% |
[ 1.5% - 2.0% ] 1.58% | 49,898 | 36.6% |
[ 1.5% - 2.0% ] 1.60% | 8,225 | 39.7% |
[ 1.5% - 2.0% ] 1.65% | 15,132 | 16.1% |
[ 1.5% - 2.0% ] 1.73% | 29,307 | 30.2% |
[ 1.5% - 2.0% ] 1.87% | 44,461 | 34.9% |
[ 1.5% - 2.0% ] 1.88% | 1,489 | 55.4% |
[ 2.0% - 2.5% ] 2.13% | 2,582 | 57.7% |
[ 2.0% - 2.5% ] 2.15% | 8,134 | 49.8% |
[ 2.0% - 2.5% ] 2.23% | 1,033 | 52.4% |
[ 2.5% - 3.0% ] 2.51% | 33,528 | 37.4% |
[ 2.5% - 3.0% ] 2.70% | 408 | 41.1% |
[ 2.5% - 3.0% ] 2.85% | 1,932 | 42.9% |
[ 4.0% - 4.5% ] 4.44% | 834 | 64.6% |
[ 4.5% - 5.0% ] 4.68% | 770 | 87.4% |
[ 4.5% - 5.0% ] 4.87% | 1,129 | 48.5% |
[ 6.0% - 6.5% ] 6.48% | 895 | 66.5% |