Immigrants from Belize vs Immigrants from Burma/Myanmar Disability Age 5 to 17

COMPARE

Immigrants from Belize
Race
Ancestry
AfghanAfricanAlaska NativeAlaskan AthabascanAlbanianAleutAlsatianAmericanApacheArabArapahoArgentineanArmenianAssyrian/Chaldean/SyriacAustralianAustrianBahamianBangladeshiBarbadianBasqueBelgianBelizeanBermudanBhutaneseBlackfeetBolivianBrazilianBritishBritish West IndianBulgarianBurmeseCajunCambodianCanadianCape VerdeanCarpatho RusynCelticCentral AmericanCentral American IndianCherokeeCheyenneChickasawChileanChineseChippewaChoctawColombianColvilleComancheCosta RicanCreeCreekCroatianCrowCubanCypriotCzechCzechoslovakianDanishDelawareDominicanDutchDutch West IndianEastern EuropeanEcuadorianEgyptianEnglishEstonianEthiopianEuropeanFijianFilipinoFinnishFrenchFrench American IndianFrench CanadianGermanGerman RussianGhanaianGreekGuamanian/ChamorroGuatemalanGuyaneseHaitianHmongHonduranHopiHoumaHungarianIcelanderIndian (Asian)IndonesianInupiatIranianIraqiIrishIroquoisIsraeliItalianJamaicanJapaneseJordanianKenyanKiowaKoreanLaotianLatvianLebaneseLiberianLithuanianLumbeeLuxembourgerMacedonianMalaysianMalteseMarshalleseMenomineeMexicanMexican American IndianMongolianMoroccanNative HawaiianNavajoNepaleseNew ZealanderNicaraguanNigerianNorthern EuropeanNorwegianOkinawanOsageOttawaPaiutePakistaniPalestinianPanamanianParaguayanPennsylvania GermanPeruvianPimaPolishPortuguesePotawatomiPuebloPuerto RicanPuget Sound SalishRomanianRussianSalvadoranSamoanScandinavianScotch-IrishScottishSeminoleSenegaleseSerbianShoshoneSierra LeoneanSiouxSlavicSlovakSloveneSomaliSouth AfricanSouth AmericanSouth American IndianSoviet UnionSpaniardSpanishSpanish AmericanSpanish American IndianSri LankanSubsaharan AfricanSudaneseSwedishSwissSyrianTaiwaneseThaiTlingit-HaidaTohono O'OdhamTonganTrinidadian and TobagonianTsimshianTurkishU.S. Virgin IslanderUgandanUkrainianUruguayanUteVenezuelanVietnameseWelshWest IndianYakamaYaquiYugoslavianYumanYup'ikZimbabwean
Immigration
NonimmigrantsImmigrantsAfghanistanAfricaAlbaniaArgentinaArmeniaAsiaAustraliaAustriaBahamasBangladeshBarbadosBelarusBelgiumBelizeBoliviaBosnia and HerzegovinaBrazilBulgariaCabo VerdeCambodiaCameroonCanadaCaribbeanCentral AmericaChileChinaColombiaCongoCosta RicaCroatiaCubaCzechoslovakiaDenmarkDominicaDominican RepublicEastern AfricaEastern AsiaEastern EuropeEcuadorEgyptEl SalvadorEnglandEritreaEthiopiaEuropeFijiFranceGermanyGhanaGreeceGrenadaGuatemalaGuyanaHaitiHondurasHong KongHungaryIndiaIndonesiaIranIraqIrelandIsraelItalyJamaicaJapanJordanKazakhstanKenyaKoreaKuwaitLaosLatin AmericaLatviaLebanonLiberiaLithuaniaMalaysiaMexicoMicronesiaMiddle AfricaMoldovaMoroccoNepalNetherlandsNicaraguaNigeriaNorth AmericaNorth MacedoniaNorthern AfricaNorthern EuropeNorwayOceaniaPakistanPanamaPeruPhilippinesPolandPortugalRomaniaRussiaSaudi ArabiaScotlandSenegalSerbiaSierra LeoneSingaporeSomaliaSouth AfricaSouth AmericaSouth Central AsiaSouth Eastern AsiaSouthern EuropeSpainSri LankaSt. Vincent and the GrenadinesSudanSwedenSwitzerlandSyriaTaiwanThailandTrinidad and TobagoTurkeyUgandaUkraineUruguayUzbekistanVenezuelaVietnamWest IndiesWestern AfricaWestern AsiaWestern EuropeYemenZaireZimbabweAzores
Immigrants from Burma/Myanmar
Race
Ancestry
AfghanAfricanAlaska NativeAlaskan AthabascanAlbanianAleutAlsatianAmericanApacheArabArapahoArgentineanArmenianAssyrian/Chaldean/SyriacAustralianAustrianBahamianBangladeshiBarbadianBasqueBelgianBelizeanBermudanBhutaneseBlackfeetBolivianBrazilianBritishBritish West IndianBulgarianBurmeseCajunCambodianCanadianCape VerdeanCarpatho RusynCelticCentral AmericanCentral American IndianCherokeeCheyenneChickasawChileanChineseChippewaChoctawColombianColvilleComancheCosta RicanCreeCreekCroatianCrowCubanCypriotCzechCzechoslovakianDanishDelawareDominicanDutchDutch West IndianEastern EuropeanEcuadorianEgyptianEnglishEstonianEthiopianEuropeanFijianFilipinoFinnishFrenchFrench American IndianFrench CanadianGermanGerman RussianGhanaianGreekGuamanian/ChamorroGuatemalanGuyaneseHaitianHmongHonduranHopiHoumaHungarianIcelanderIndian (Asian)IndonesianInupiatIranianIraqiIrishIroquoisIsraeliItalianJamaicanJapaneseJordanianKenyanKiowaKoreanLaotianLatvianLebaneseLiberianLithuanianLumbeeLuxembourgerMacedonianMalaysianMalteseMarshalleseMenomineeMexicanMexican American IndianMongolianMoroccanNative HawaiianNavajoNepaleseNew ZealanderNicaraguanNigerianNorthern EuropeanNorwegianOkinawanOsageOttawaPaiutePakistaniPalestinianPanamanianParaguayanPennsylvania GermanPeruvianPimaPolishPortuguesePotawatomiPuebloPuerto RicanPuget Sound SalishRomanianRussianSalvadoranSamoanScandinavianScotch-IrishScottishSeminoleSenegaleseSerbianShoshoneSierra LeoneanSiouxSlavicSlovakSloveneSomaliSouth AfricanSouth AmericanSouth American IndianSoviet UnionSpaniardSpanishSpanish AmericanSpanish American IndianSri LankanSubsaharan AfricanSudaneseSwedishSwissSyrianTaiwaneseThaiTlingit-HaidaTohono O'OdhamTonganTrinidadian and TobagonianTsimshianTurkishU.S. Virgin IslanderUgandanUkrainianUruguayanUteVenezuelanVietnameseWelshWest IndianYakamaYaquiYugoslavianYumanYup'ikZimbabwean
Immigration
NonimmigrantsImmigrantsAfghanistanAfricaAlbaniaArgentinaArmeniaAsiaAustraliaAustriaBahamasBangladeshBarbadosBelarusBelgiumBoliviaBosnia and HerzegovinaBrazilBulgariaBurma/MyanmarCabo VerdeCambodiaCameroonCanadaCaribbeanCentral AmericaChileChinaColombiaCongoCosta RicaCroatiaCubaCzechoslovakiaDenmarkDominicaDominican RepublicEastern AfricaEastern AsiaEastern EuropeEcuadorEgyptEl SalvadorEnglandEritreaEthiopiaEuropeFijiFranceGermanyGhanaGreeceGrenadaGuatemalaGuyanaHaitiHondurasHong KongHungaryIndiaIndonesiaIranIraqIrelandIsraelItalyJamaicaJapanJordanKazakhstanKenyaKoreaKuwaitLaosLatin AmericaLatviaLebanonLiberiaLithuaniaMalaysiaMexicoMicronesiaMiddle AfricaMoldovaMoroccoNepalNetherlandsNicaraguaNigeriaNorth AmericaNorth MacedoniaNorthern AfricaNorthern EuropeNorwayOceaniaPakistanPanamaPeruPhilippinesPolandPortugalRomaniaRussiaSaudi ArabiaScotlandSenegalSerbiaSierra LeoneSingaporeSomaliaSouth AfricaSouth AmericaSouth Central AsiaSouth Eastern AsiaSouthern EuropeSpainSri LankaSt. Vincent and the GrenadinesSudanSwedenSwitzerlandSyriaTaiwanThailandTrinidad and TobagoTurkeyUgandaUkraineUruguayUzbekistanVenezuelaVietnamWest IndiesWestern AfricaWestern AsiaWestern EuropeYemenZaireZimbabweAzores
Disability Age 5 to 17
Income
Poverty
Unemployment
Labor Participation
Family Structure
Vehicle Availability
Education Level
Disability

Disability Age 5 to 17 Comparison

Immigrants from Belize

Immigrants from Burma/Myanmar

Exceptional
Average
5.4%
DISABILITY AGE 5 TO 17
91.7/ 100
METRIC RATING
135th/ 347
METRIC RANK
5.6%
DISABILITY AGE 5 TO 17
59.3/ 100
METRIC RATING
167th/ 347
METRIC RANK

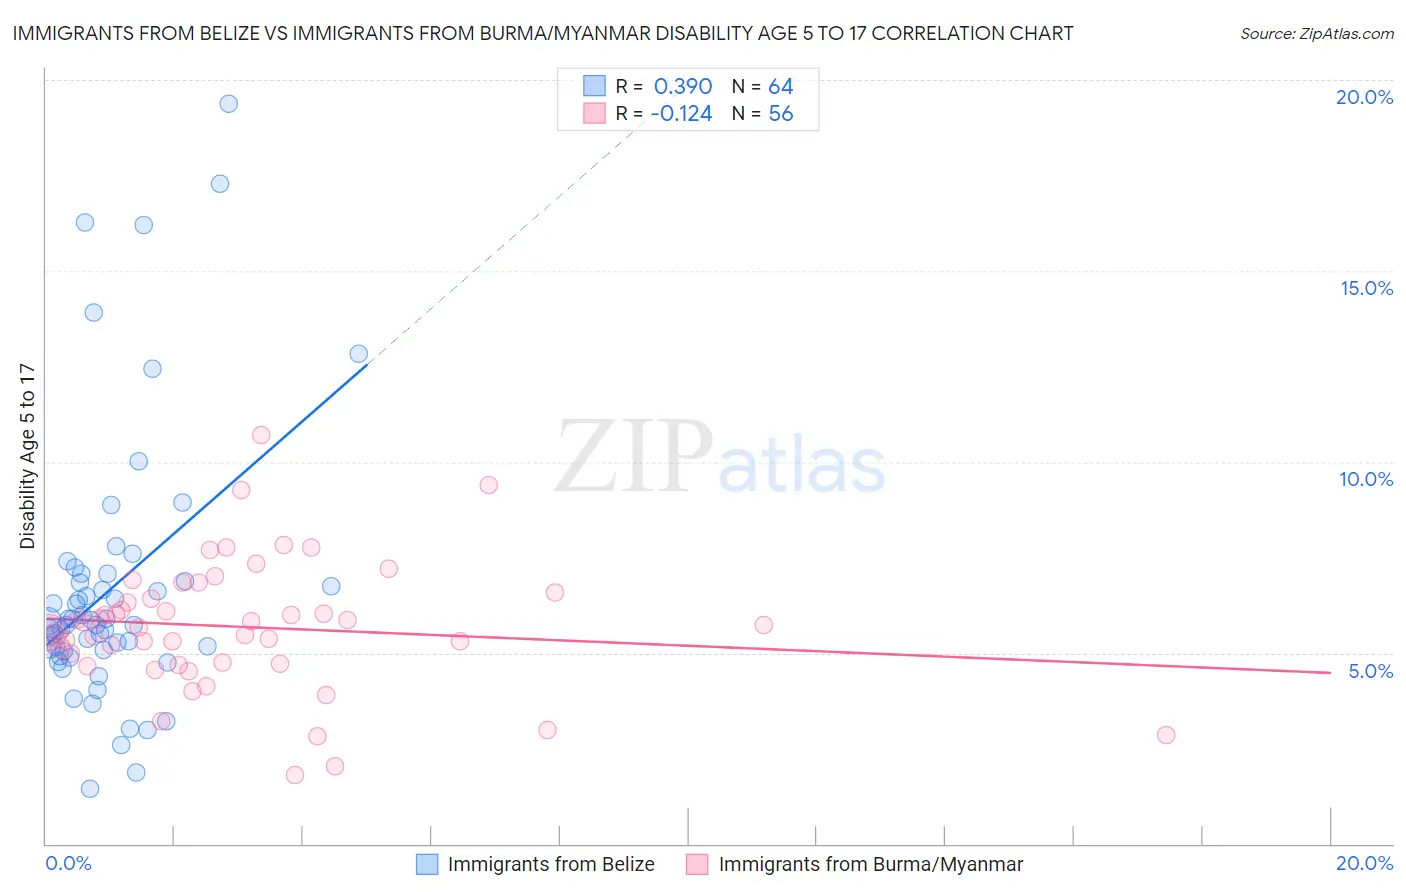
Immigrants from Belize vs Immigrants from Burma/Myanmar Disability Age 5 to 17 Correlation Chart

The statistical analysis conducted on geographies consisting of 129,905,641 people shows a mild positive correlation between the proportion of Immigrants from Belize and percentage of population with a disability between the ages 5 and 17 in the United States with a correlation coefficient (R) of 0.390 and weighted average of 5.4%. Similarly, the statistical analysis conducted on geographies consisting of 171,966,174 people shows a poor negative correlation between the proportion of Immigrants from Burma/Myanmar and percentage of population with a disability between the ages 5 and 17 in the United States with a correlation coefficient (R) of -0.124 and weighted average of 5.6%, a difference of 2.6%.
Immigrants from Belize vs Immigrants from Burma/Myanmar Disability Age 5 to 17

Disability Age 5 to 17 Correlation Summary

MeasurementImmigrants from BelizeImmigrants from Burma/Myanmar
Minimum1.4%1.8%
Maximum19.4%10.7%
Range17.9%8.9%
Mean6.7%5.7%
Median5.8%5.7%
Interquartile 25% (IQ1)5.1%4.7%
Interquartile 75% (IQ3)7.0%6.5%
Interquartile Range (IQR)1.9%1.8%
Standard Deviation (Sample)3.5%1.7%
Standard Deviation (Population)3.5%1.7%

Similar Demographics by Disability Age 5 to 17

Demographics Similar to Immigrants from Belize by Disability Age 5 to 17

In terms of disability age 5 to 17, the demographic groups most similar to Immigrants from Belize are Immigrants from Denmark (5.4%, a difference of 0.050%), Yuman (5.4%, a difference of 0.10%), Navajo (5.4%, a difference of 0.13%), Immigrants from Oceania (5.4%, a difference of 0.14%), and Belizean (5.4%, a difference of 0.14%).
DemographicsRating | RankDisability Age 5 to 17
Immigrants | Venezuela
94.5
/100
|
#128
Exceptional
5.4%
Romanians
94.1
/100
|
#129
Exceptional
5.4%
Immigrants | Bulgaria
94.0
/100
|
#130
Exceptional
5.4%
Arabs
92.9
/100
|
#131
Exceptional
5.4%
Immigrants | Colombia
92.9
/100
|
#132
Exceptional
5.4%
Venezuelans
92.7
/100
|
#133
Exceptional
5.4%
Yuman
92.3
/100
|
#134
Exceptional
5.4%
Immigrants | Belize
91.7
/100
|
#135
Exceptional
5.4%
Immigrants | Denmark
91.4
/100
|
#136
Exceptional
5.4%
Navajo
90.9
/100
|
#137
Exceptional
5.4%
Immigrants | Oceania
90.8
/100
|
#138
Exceptional
5.4%
Belizeans
90.8
/100
|
#139
Exceptional
5.4%
Immigrants | Netherlands
90.5
/100
|
#140
Exceptional
5.4%
South American Indians
89.3
/100
|
#141
Excellent
5.5%
Colombians
88.0
/100
|
#142
Excellent
5.5%

Demographics Similar to Immigrants from Burma/Myanmar by Disability Age 5 to 17

In terms of disability age 5 to 17, the demographic groups most similar to Immigrants from Burma/Myanmar are Greek (5.6%, a difference of 0.070%), Lebanese (5.6%, a difference of 0.11%), Immigrants from Scotland (5.6%, a difference of 0.13%), Iraqi (5.6%, a difference of 0.17%), and Immigrants from Norway (5.6%, a difference of 0.18%).
DemographicsRating | RankDisability Age 5 to 17
South Africans
73.3
/100
|
#160
Good
5.5%
Immigrants | Saudi Arabia
69.1
/100
|
#161
Good
5.5%
Zimbabweans
67.2
/100
|
#162
Good
5.5%
Immigrants | Southern Europe
64.0
/100
|
#163
Good
5.6%
Immigrants | Scotland
61.9
/100
|
#164
Good
5.6%
Lebanese
61.4
/100
|
#165
Good
5.6%
Greeks
60.6
/100
|
#166
Good
5.6%
Immigrants | Burma/Myanmar
59.3
/100
|
#167
Average
5.6%
Iraqis
56.0
/100
|
#168
Average
5.6%
Immigrants | Norway
55.7
/100
|
#169
Average
5.6%
Serbians
54.0
/100
|
#170
Average
5.6%
Immigrants | Iraq
53.9
/100
|
#171
Average
5.6%
Ukrainians
51.5
/100
|
#172
Average
5.6%
Uruguayans
51.0
/100
|
#173
Average
5.6%
Costa Ricans
50.0
/100
|
#174
Average
5.6%