Immigrants from the Azores Self-Care Disability
COMPARE
Immigrants from the Azores
Select to Compare
Self-Care Disability
Immigrants from the Azores Self-Care Disability
3.0%
SELF-CARE DISABILITY
0.0/ 100
METRIC RATING
335th/ 347
METRIC RANK
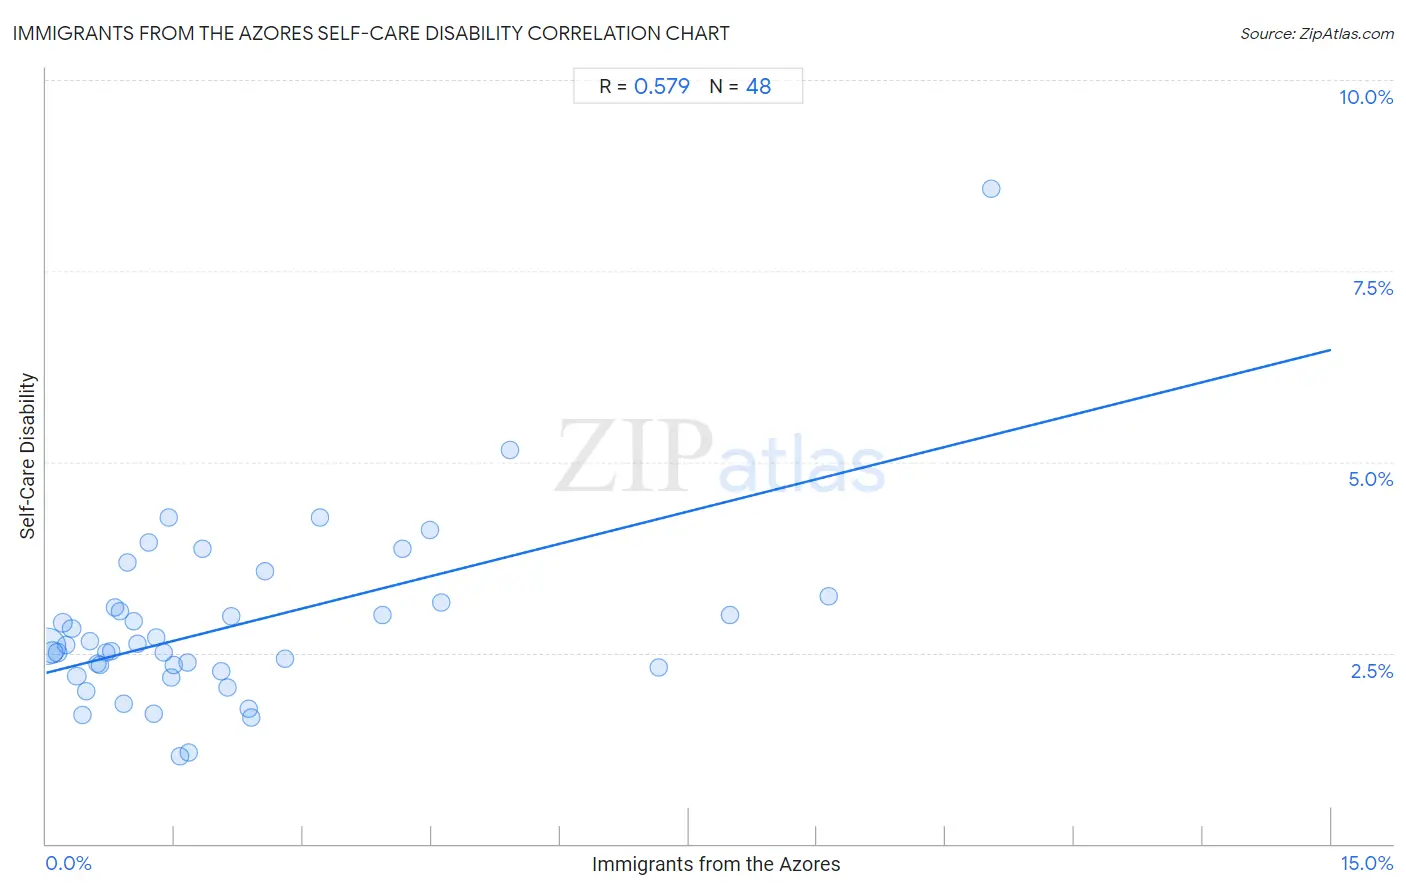
Immigrants from the Azores Self-Care Disability Correlation Chart
The statistical analysis conducted on geographies consisting of 46,255,700 people shows a substantial positive correlation between the proportion of Immigrants from the Azores and percentage of population with self-care disability in the United States with a correlation coefficient (R) of 0.579 and weighted average of 3.0%. On average, for every 1% (one percent) increase in Immigrants from the Azores within a typical geography, there is an increase of 0.28% in percentage of population with self-care disability.
It is essential to understand that the correlation between the percentage of Immigrants from the Azores and percentage of population with self-care disability does not imply a direct cause-and-effect relationship. It remains uncertain whether the presence of Immigrants from the Azores influences an upward or downward trend in the level of percentage of population with self-care disability within an area, or if Immigrants from the Azores simply ended up residing in those areas with higher or lower levels of percentage of population with self-care disability due to other factors.
Demographics Similar to Immigrants from the Azores by Self-Care Disability
In terms of self-care disability, the demographic groups most similar to Immigrants from the Azores are Houma (3.0%, a difference of 0.050%), Dutch West Indian (3.0%, a difference of 0.12%), Immigrants from Yemen (3.0%, a difference of 0.16%), Kiowa (3.0%, a difference of 0.35%), and Lumbee (3.0%, a difference of 0.71%).
| Demographics | Rating | Rank | Self-Care Disability |
| Hopi | 0.0 /100 | #328 | Tragic 2.9% |
| Cajuns | 0.0 /100 | #329 | Tragic 2.9% |
| Nepalese | 0.0 /100 | #330 | Tragic 3.0% |
| Lumbee | 0.0 /100 | #331 | Tragic 3.0% |
| Kiowa | 0.0 /100 | #332 | Tragic 3.0% |
| Dutch West Indians | 0.0 /100 | #333 | Tragic 3.0% |
| Houma | 0.0 /100 | #334 | Tragic 3.0% |
| Immigrants from the Azores | 0.0 /100 | #335 | Tragic 3.0% |
| Immigrants from Yemen | 0.0 /100 | #336 | Tragic 3.0% |
| Choctaw | 0.0 /100 | #337 | Tragic 3.0% |
| Cape Verdeans | 0.0 /100 | #338 | Tragic 3.0% |
| Immigrants from Dominican Republic | 0.0 /100 | #339 | Tragic 3.0% |
| Immigrants from Cabo Verde | 0.0 /100 | #340 | Tragic 3.1% |
| Dominicans | 0.0 /100 | #341 | Tragic 3.1% |
| Colville | 0.0 /100 | #342 | Tragic 3.1% |
Immigrants from the Azores Self-Care Disability Correlation Summary
| Measurement | Immigrants from the Azores Data | Self-Care Disability Data |
| Minimum | 0.012% | 1.1% |
| Maximum | 11.0% | 8.6% |
| Range | 11.0% | 7.4% |
| Mean | 2.2% | 2.9% |
| Median | 1.4% | 2.6% |
| Interquartile 25% (IQ1) | 0.66% | 2.3% |
| Interquartile 75% (IQ3) | 2.5% | 3.1% |
| Interquartile Range (IQR) | 1.8% | 0.84% |
| Standard Deviation (Sample) | 2.4% | 1.2% |
| Standard Deviation (Population) | 2.4% | 1.2% |
Correlation Details
| Immigrants from the Azores Percentile | Sample Size | Self-Care Disability |
[ 0.0% - 0.5% ] 0.012% | 32,839,072 | 2.6% |
[ 0.0% - 0.5% ] 0.077% | 6,962,859 | 2.5% |
[ 0.0% - 0.5% ] 0.13% | 1,784,267 | 2.5% |
[ 0.0% - 0.5% ] 0.19% | 1,140,186 | 2.9% |
[ 0.0% - 0.5% ] 0.24% | 289,747 | 2.6% |
[ 0.0% - 0.5% ] 0.30% | 754,013 | 2.8% |
[ 0.0% - 0.5% ] 0.36% | 342,914 | 2.2% |
[ 0.0% - 0.5% ] 0.42% | 119,391 | 1.7% |
[ 0.0% - 0.5% ] 0.47% | 119,416 | 2.0% |
[ 0.5% - 1.0% ] 0.51% | 244,880 | 2.7% |
[ 0.5% - 1.0% ] 0.59% | 140,208 | 2.4% |
[ 0.5% - 1.0% ] 0.62% | 244,823 | 2.3% |
[ 0.5% - 1.0% ] 0.70% | 94,840 | 2.5% |
[ 0.5% - 1.0% ] 0.76% | 180,630 | 2.5% |
[ 0.5% - 1.0% ] 0.80% | 140,825 | 3.1% |
[ 0.5% - 1.0% ] 0.87% | 41,094 | 3.0% |
[ 0.5% - 1.0% ] 0.90% | 31,945 | 1.8% |
[ 0.5% - 1.0% ] 0.95% | 194,605 | 3.7% |
[ 1.0% - 1.5% ] 1.03% | 109,020 | 2.9% |
[ 1.0% - 1.5% ] 1.07% | 24,297 | 2.6% |
[ 1.0% - 1.5% ] 1.19% | 336 | 4.0% |
[ 1.0% - 1.5% ] 1.25% | 4,463 | 1.7% |
[ 1.0% - 1.5% ] 1.28% | 32,156 | 2.7% |
[ 1.0% - 1.5% ] 1.36% | 11,431 | 2.5% |
[ 1.0% - 1.5% ] 1.42% | 1,123 | 4.3% |
[ 1.0% - 1.5% ] 1.46% | 15,907 | 2.2% |
[ 1.0% - 1.5% ] 1.49% | 25,847 | 2.3% |
[ 1.5% - 2.0% ] 1.57% | 7,154 | 1.1% |
[ 1.5% - 2.0% ] 1.65% | 2,359 | 2.4% |
[ 1.5% - 2.0% ] 1.67% | 3,662 | 1.2% |
[ 1.5% - 2.0% ] 1.82% | 4,660 | 3.9% |
[ 2.0% - 2.5% ] 2.04% | 17,158 | 2.3% |
[ 2.0% - 2.5% ] 2.11% | 13,781 | 2.0% |
[ 2.0% - 2.5% ] 2.16% | 5,591 | 3.0% |
[ 2.0% - 2.5% ] 2.36% | 891 | 1.8% |
[ 2.0% - 2.5% ] 2.40% | 22,420 | 1.7% |
[ 2.5% - 3.0% ] 2.55% | 47,012 | 3.6% |
[ 2.5% - 3.0% ] 2.79% | 3,620 | 2.4% |
[ 3.0% - 3.5% ] 3.19% | 17,164 | 4.3% |
[ 3.5% - 4.0% ] 3.93% | 535 | 3.0% |
[ 4.0% - 4.5% ] 4.15% | 18,445 | 3.9% |
[ 4.0% - 4.5% ] 4.47% | 131,562 | 4.1% |
[ 4.5% - 5.0% ] 4.61% | 21,742 | 3.2% |
[ 5.0% - 5.5% ] 5.41% | 30,558 | 5.1% |
[ 7.0% - 7.5% ] 7.15% | 1,581 | 2.3% |
[ 7.5% - 8.0% ] 7.98% | 8,763 | 3.0% |
[ 9.0% - 9.5% ] 9.13% | 6,484 | 3.2% |
[ 11.0% - 11.5% ] 11.03% | 263 | 8.6% |