Immigrants from the Azores Married-couple Households
COMPARE
Immigrants from the Azores
Select to Compare
Married-couple Households
Immigrants from the Azores Married-couple Households
45.2%
MARRIED-COUPLE HOUSEHOLDS
5.3/ 100
METRIC RATING
218th/ 347
METRIC RANK
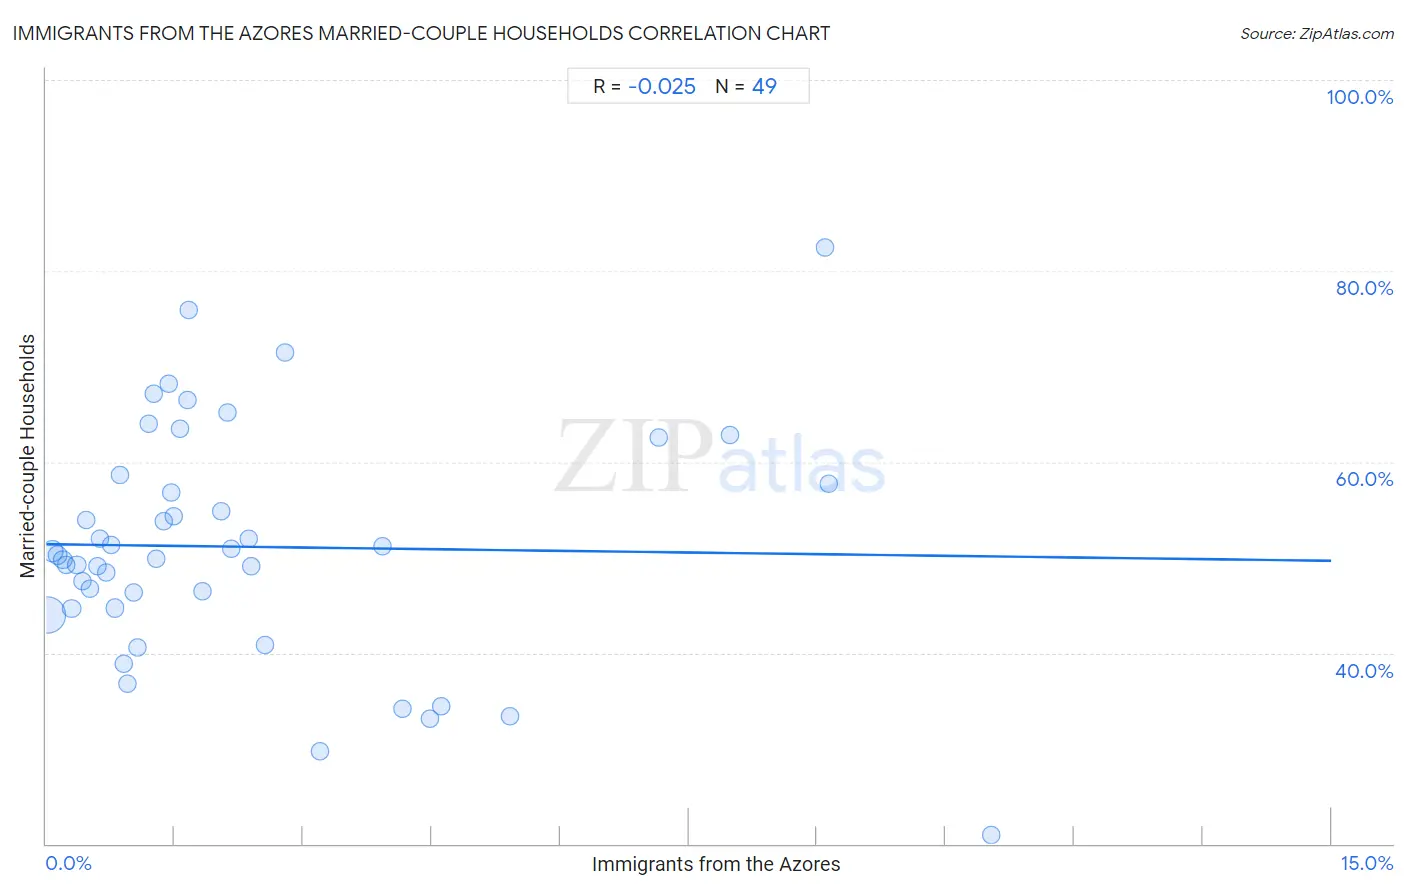
Immigrants from the Azores Married-couple Households Correlation Chart
The statistical analysis conducted on geographies consisting of 46,257,310 people shows no correlation between the proportion of Immigrants from the Azores and percentage of married-couple family households in the United States with a correlation coefficient (R) of -0.025 and weighted average of 45.2%. On average, for every 1% (one percent) increase in Immigrants from the Azores within a typical geography, there is a decrease of 0.12% in percentage of married-couple family households.
It is essential to understand that the correlation between the percentage of Immigrants from the Azores and percentage of married-couple family households does not imply a direct cause-and-effect relationship. It remains uncertain whether the presence of Immigrants from the Azores influences an upward or downward trend in the level of percentage of married-couple family households within an area, or if Immigrants from the Azores simply ended up residing in those areas with higher or lower levels of percentage of married-couple family households due to other factors.
Demographics Similar to Immigrants from the Azores by Married-couple Households
In terms of married-couple households, the demographic groups most similar to Immigrants from the Azores are Nicaraguan (45.2%, a difference of 0.010%), Panamanian (45.2%, a difference of 0.030%), Immigrants from Thailand (45.2%, a difference of 0.040%), Immigrants from Nepal (45.2%, a difference of 0.050%), and Immigrants from Portugal (45.2%, a difference of 0.050%).
| Demographics | Rating | Rank | Married-couple Households |
| Immigrants from Spain | 7.3 /100 | #211 | Tragic 45.3% |
| Creek | 6.4 /100 | #212 | Tragic 45.3% |
| Yakama | 5.8 /100 | #213 | Tragic 45.2% |
| Japanese | 5.7 /100 | #214 | Tragic 45.2% |
| Immigrants from Nepal | 5.6 /100 | #215 | Tragic 45.2% |
| Immigrants from Portugal | 5.6 /100 | #216 | Tragic 45.2% |
| Panamanians | 5.5 /100 | #217 | Tragic 45.2% |
| Immigrants from the Azores | 5.3 /100 | #218 | Tragic 45.2% |
| Nicaraguans | 5.3 /100 | #219 | Tragic 45.2% |
| Immigrants from Thailand | 5.1 /100 | #220 | Tragic 45.2% |
| Tlingit-Haida | 4.9 /100 | #221 | Tragic 45.1% |
| Immigrants from Laos | 4.6 /100 | #222 | Tragic 45.1% |
| Immigrants from Cambodia | 2.7 /100 | #223 | Tragic 44.9% |
| Immigrants from Micronesia | 2.6 /100 | #224 | Tragic 44.9% |
| Dutch West Indians | 2.6 /100 | #225 | Tragic 44.9% |
Immigrants from the Azores Married-couple Households Correlation Summary
| Measurement | Immigrants from the Azores Data | Married-couple Households Data |
| Minimum | 0.012% | 21.0% |
| Maximum | 11.0% | 82.5% |
| Range | 11.0% | 61.5% |
| Mean | 2.3% | 51.1% |
| Median | 1.4% | 50.2% |
| Interquartile 25% (IQ1) | 0.66% | 44.7% |
| Interquartile 75% (IQ3) | 2.7% | 58.1% |
| Interquartile Range (IQR) | 2.0% | 13.4% |
| Standard Deviation (Sample) | 2.6% | 12.2% |
| Standard Deviation (Population) | 2.6% | 12.1% |
Correlation Details
| Immigrants from the Azores Percentile | Sample Size | Married-couple Households |
[ 0.0% - 0.5% ] 0.012% | 32,839,072 | 44.0% |
[ 0.0% - 0.5% ] 0.077% | 6,962,859 | 50.7% |
[ 0.0% - 0.5% ] 0.13% | 1,784,267 | 50.2% |
[ 0.0% - 0.5% ] 0.19% | 1,140,186 | 49.7% |
[ 0.0% - 0.5% ] 0.24% | 289,747 | 49.2% |
[ 0.0% - 0.5% ] 0.30% | 754,013 | 44.6% |
[ 0.0% - 0.5% ] 0.36% | 342,914 | 49.2% |
[ 0.0% - 0.5% ] 0.42% | 119,391 | 47.5% |
[ 0.0% - 0.5% ] 0.47% | 119,416 | 53.9% |
[ 0.5% - 1.0% ] 0.51% | 244,880 | 46.7% |
[ 0.5% - 1.0% ] 0.59% | 140,565 | 49.1% |
[ 0.5% - 1.0% ] 0.62% | 244,823 | 51.9% |
[ 0.5% - 1.0% ] 0.70% | 94,840 | 48.4% |
[ 0.5% - 1.0% ] 0.76% | 180,630 | 51.2% |
[ 0.5% - 1.0% ] 0.80% | 140,825 | 44.7% |
[ 0.5% - 1.0% ] 0.87% | 41,094 | 58.6% |
[ 0.5% - 1.0% ] 0.90% | 33,066 | 38.8% |
[ 0.5% - 1.0% ] 0.95% | 194,605 | 36.8% |
[ 1.0% - 1.5% ] 1.03% | 109,020 | 46.3% |
[ 1.0% - 1.5% ] 1.07% | 24,297 | 40.6% |
[ 1.0% - 1.5% ] 1.19% | 336 | 64.0% |
[ 1.0% - 1.5% ] 1.25% | 4,463 | 67.2% |
[ 1.0% - 1.5% ] 1.28% | 32,156 | 49.9% |
[ 1.0% - 1.5% ] 1.36% | 11,431 | 53.7% |
[ 1.0% - 1.5% ] 1.42% | 1,123 | 68.1% |
[ 1.0% - 1.5% ] 1.46% | 15,907 | 56.8% |
[ 1.0% - 1.5% ] 1.49% | 25,847 | 54.3% |
[ 1.5% - 2.0% ] 1.57% | 7,154 | 63.4% |
[ 1.5% - 2.0% ] 1.65% | 2,359 | 66.4% |
[ 1.5% - 2.0% ] 1.67% | 3,662 | 75.9% |
[ 1.5% - 2.0% ] 1.82% | 4,660 | 46.5% |
[ 2.0% - 2.5% ] 2.04% | 17,158 | 54.8% |
[ 2.0% - 2.5% ] 2.11% | 13,781 | 65.1% |
[ 2.0% - 2.5% ] 2.16% | 5,591 | 51.0% |
[ 2.0% - 2.5% ] 2.36% | 891 | 51.9% |
[ 2.0% - 2.5% ] 2.40% | 22,420 | 49.1% |
[ 2.5% - 3.0% ] 2.55% | 47,012 | 40.8% |
[ 2.5% - 3.0% ] 2.79% | 3,620 | 71.4% |
[ 3.0% - 3.5% ] 3.19% | 17,164 | 29.7% |
[ 3.5% - 4.0% ] 3.93% | 535 | 51.1% |
[ 4.0% - 4.5% ] 4.15% | 18,445 | 34.1% |
[ 4.0% - 4.5% ] 4.47% | 131,562 | 33.0% |
[ 4.5% - 5.0% ] 4.61% | 21,742 | 34.4% |
[ 5.0% - 5.5% ] 5.41% | 30,558 | 33.3% |
[ 7.0% - 7.5% ] 7.15% | 1,581 | 62.6% |
[ 7.5% - 8.0% ] 7.98% | 8,763 | 62.8% |
[ 9.0% - 9.5% ] 9.09% | 132 | 82.5% |
[ 9.0% - 9.5% ] 9.13% | 6,484 | 57.7% |
[ 11.0% - 11.5% ] 11.03% | 263 | 21.0% |