Immigrants from the Azores Wage/Income Gap

COMPARE

Immigrants from the Azores
Race
Ancestry
AfghanAfricanAlaska NativeAlaskan AthabascanAlbanianAleutAlsatianAmericanApacheArabArapahoArgentineanArmenianAssyrian/Chaldean/SyriacAustralianAustrianBahamianBangladeshiBarbadianBasqueBelgianBelizeanBermudanBhutaneseBlackfeetBolivianBrazilianBritishBritish West IndianBulgarianBurmeseCajunCambodianCanadianCape VerdeanCarpatho RusynCelticCentral AmericanCentral American IndianCherokeeCheyenneChickasawChileanChineseChippewaChoctawColombianColvilleComancheCosta RicanCreeCreekCroatianCrowCubanCypriotCzechCzechoslovakianDanishDelawareDominicanDutchDutch West IndianEastern EuropeanEcuadorianEgyptianEnglishEstonianEthiopianEuropeanFijianFilipinoFinnishFrenchFrench American IndianFrench CanadianGermanGerman RussianGhanaianGreekGuamanian/ChamorroGuatemalanGuyaneseHaitianHmongHonduranHopiHoumaHungarianIcelanderIndian (Asian)IndonesianInupiatIranianIraqiIrishIroquoisIsraeliItalianJamaicanJapaneseJordanianKenyanKiowaKoreanLaotianLatvianLebaneseLiberianLithuanianLumbeeLuxembourgerMacedonianMalaysianMalteseMarshalleseMenomineeMexicanMexican American IndianMongolianMoroccanNative HawaiianNavajoNepaleseNew ZealanderNicaraguanNigerianNorthern EuropeanNorwegianOkinawanOsageOttawaPaiutePakistaniPalestinianPanamanianParaguayanPennsylvania GermanPeruvianPimaPolishPortuguesePotawatomiPuebloPuerto RicanPuget Sound SalishRomanianRussianSalvadoranSamoanScandinavianScotch-IrishScottishSeminoleSenegaleseSerbianShoshoneSierra LeoneanSiouxSlavicSlovakSloveneSomaliSouth AfricanSouth AmericanSouth American IndianSoviet UnionSpaniardSpanishSpanish AmericanSpanish American IndianSri LankanSubsaharan AfricanSudaneseSwedishSwissSyrianTaiwaneseThaiTlingit-HaidaTohono O'OdhamTonganTrinidadian and TobagonianTsimshianTurkishU.S. Virgin IslanderUgandanUkrainianUruguayanUteVenezuelanVietnameseWelshWest IndianYakamaYaquiYugoslavianYumanYup'ikZimbabwean
Immigration
NonimmigrantsImmigrantsAfghanistanAfricaAlbaniaArgentinaArmeniaAsiaAustraliaAustriaBahamasBangladeshBarbadosBelarusBelgiumBelizeBoliviaBosnia and HerzegovinaBrazilBulgariaBurma/MyanmarCabo VerdeCambodiaCameroonCanadaCaribbeanCentral AmericaChileChinaColombiaCongoCosta RicaCroatiaCubaCzechoslovakiaDenmarkDominicaDominican RepublicEastern AfricaEastern AsiaEastern EuropeEcuadorEgyptEl SalvadorEnglandEritreaEthiopiaEuropeFijiFranceGermanyGhanaGreeceGrenadaGuatemalaGuyanaHaitiHondurasHong KongHungaryIndiaIndonesiaIranIraqIrelandIsraelItalyJamaicaJapanJordanKazakhstanKenyaKoreaKuwaitLaosLatin AmericaLatviaLebanonLiberiaLithuaniaMalaysiaMexicoMicronesiaMiddle AfricaMoldovaMoroccoNepalNetherlandsNicaraguaNigeriaNorth AmericaNorth MacedoniaNorthern AfricaNorthern EuropeNorwayOceaniaPakistanPanamaPeruPhilippinesPolandPortugalRomaniaRussiaSaudi ArabiaScotlandSenegalSerbiaSierra LeoneSingaporeSomaliaSouth AfricaSouth AmericaSouth Central AsiaSouth Eastern AsiaSouthern EuropeSpainSri LankaSt. Vincent and the GrenadinesSudanSwedenSwitzerlandSyriaTaiwanThailandTrinidad and TobagoTurkeyUgandaUkraineUruguayUzbekistanVenezuelaVietnamWest IndiesWestern AfricaWestern AsiaWestern EuropeYemenZaireZimbabweAzores
Select to Compare
Race
Ancestry
AfghanAfricanAlaska NativeAlaskan AthabascanAlbanianAleutAlsatianAmericanApacheArabArapahoArgentineanArmenianAssyrian/Chaldean/SyriacAustralianAustrianBahamianBangladeshiBarbadianBasqueBelgianBelizeanBermudanBhutaneseBlackfeetBolivianBrazilianBritishBritish West IndianBulgarianBurmeseCajunCambodianCanadianCape VerdeanCarpatho RusynCelticCentral AmericanCentral American IndianCherokeeCheyenneChickasawChileanChineseChippewaChoctawColombianColvilleComancheCosta RicanCreeCreekCroatianCrowCubanCypriotCzechCzechoslovakianDanishDelawareDominicanDutchDutch West IndianEastern EuropeanEcuadorianEgyptianEnglishEstonianEthiopianEuropeanFijianFilipinoFinnishFrenchFrench American IndianFrench CanadianGermanGerman RussianGhanaianGreekGuamanian/ChamorroGuatemalanGuyaneseHaitianHmongHonduranHopiHoumaHungarianIcelanderIndian (Asian)IndonesianInupiatIranianIraqiIrishIroquoisIsraeliItalianJamaicanJapaneseJordanianKenyanKiowaKoreanLaotianLatvianLebaneseLiberianLithuanianLumbeeLuxembourgerMacedonianMalaysianMalteseMarshalleseMenomineeMexicanMexican American IndianMongolianMoroccanNative HawaiianNavajoNepaleseNew ZealanderNicaraguanNigerianNorthern EuropeanNorwegianOkinawanOsageOttawaPaiutePakistaniPalestinianPanamanianParaguayanPennsylvania GermanPeruvianPimaPolishPortuguesePotawatomiPuebloPuerto RicanPuget Sound SalishRomanianRussianSalvadoranSamoanScandinavianScotch-IrishScottishSeminoleSenegaleseSerbianShoshoneSierra LeoneanSiouxSlavicSlovakSloveneSomaliSouth AfricanSouth AmericanSouth American IndianSoviet UnionSpaniardSpanishSpanish AmericanSpanish American IndianSri LankanSubsaharan AfricanSudaneseSwedishSwissSyrianTaiwaneseThaiTlingit-HaidaTohono O'OdhamTonganTrinidadian and TobagonianTsimshianTurkishU.S. Virgin IslanderUgandanUkrainianUruguayanUteVenezuelanVietnameseWelshWest IndianYakamaYaquiYugoslavianYumanYup'ikZimbabwean
Immigration
NonimmigrantsImmigrantsAfghanistanAfricaAlbaniaArgentinaArmeniaAsiaAustraliaAustriaBahamasBangladeshBarbadosBelarusBelgiumBelizeBoliviaBosnia and HerzegovinaBrazilBulgariaBurma/MyanmarCabo VerdeCambodiaCameroonCanadaCaribbeanCentral AmericaChileChinaColombiaCongoCosta RicaCroatiaCubaCzechoslovakiaDenmarkDominicaDominican RepublicEastern AfricaEastern AsiaEastern EuropeEcuadorEgyptEl SalvadorEnglandEritreaEthiopiaEuropeFijiFranceGermanyGhanaGreeceGrenadaGuatemalaGuyanaHaitiHondurasHong KongHungaryIndiaIndonesiaIranIraqIrelandIsraelItalyJamaicaJapanJordanKazakhstanKenyaKoreaKuwaitLaosLatin AmericaLatviaLebanonLiberiaLithuaniaMalaysiaMexicoMicronesiaMiddle AfricaMoldovaMoroccoNepalNetherlandsNicaraguaNigeriaNorth AmericaNorth MacedoniaNorthern AfricaNorthern EuropeNorwayOceaniaPakistanPanamaPeruPhilippinesPolandPortugalRomaniaRussiaSaudi ArabiaScotlandSenegalSerbiaSierra LeoneSingaporeSomaliaSouth AfricaSouth AmericaSouth Central AsiaSouth Eastern AsiaSouthern EuropeSpainSri LankaSt. Vincent and the GrenadinesSudanSwedenSwitzerlandSyriaTaiwanThailandTrinidad and TobagoTurkeyUgandaUkraineUruguayUzbekistanVenezuelaVietnamWest IndiesWestern AfricaWestern AsiaWestern EuropeYemenZaireZimbabwe
Wage/Income Gap
Income
Poverty
Unemployment
Labor Participation
Family Structure
Vehicle Availability
Education Level
Disability

Immigrants from the Azores Wage/Income Gap
Tragic

27.2%
WAGE/INCOME GAP
3.5/ 100
METRIC RATING
245th/ 347
METRIC RANK

Immigrants from the Azores Wage/Income Gap Correlation Chart

The statistical analysis conducted on geographies consisting of 46,247,590 people shows a slight positive correlation between the proportion of Immigrants from the Azores and wage/income gap percentage in the United States with a correlation coefficient (R) of 0.062 and weighted average of 27.2%. On average, for every 1% (one percent) increase in Immigrants from the Azores within a typical geography, there is an increase of 0.42% in wage/income gap percentage.
Immigrants from the Azores Wage/Income Gap
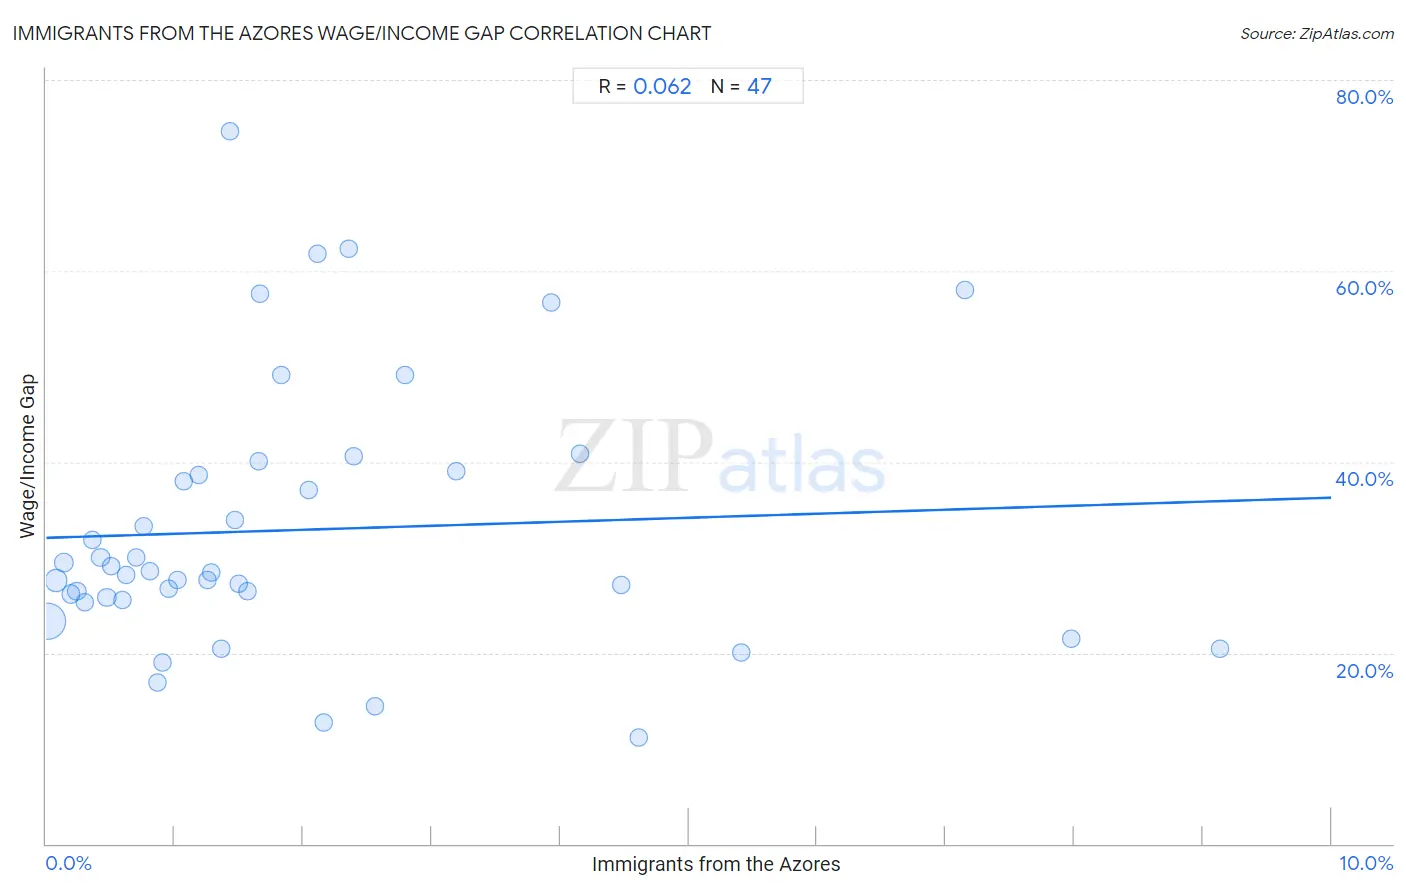
It is essential to understand that the correlation between the percentage of Immigrants from the Azores and wage/income gap percentage does not imply a direct cause-and-effect relationship. It remains uncertain whether the presence of Immigrants from the Azores influences an upward or downward trend in the level of wage/income gap percentage within an area, or if Immigrants from the Azores simply ended up residing in those areas with higher or lower levels of wage/income gap percentage due to other factors.

Demographics Similar to Immigrants from the Azores by Wage/Income Gap

In terms of wage/income gap, the demographic groups most similar to Immigrants from the Azores are Chickasaw (27.2%, a difference of 0.020%), Nonimmigrants (27.2%, a difference of 0.080%), Immigrants from Sri Lanka (27.1%, a difference of 0.090%), Spanish (27.1%, a difference of 0.090%), and Creek (27.1%, a difference of 0.14%).
DemographicsRating | RankWage/Income Gap
Osage
4.4
/100
|
#238
Tragic
27.1%
Estonians
4.3
/100
|
#239
Tragic
27.1%
Immigrants from Europe
3.8
/100
|
#240
Tragic
27.1%
Creek
3.8
/100
|
#241
Tragic
27.1%
Immigrants from Sri Lanka
3.7
/100
|
#242
Tragic
27.1%
Spanish
3.6
/100
|
#243
Tragic
27.1%
Chickasaw
3.5
/100
|
#244
Tragic
27.2%
Immigrants from the Azores
3.5
/100
|
#245
Tragic
27.2%
Nonimmigrants
3.3
/100
|
#246
Tragic
27.2%
Celtics
2.8
/100
|
#247
Tragic
27.3%
Cypriots
2.8
/100
|
#248
Tragic
27.3%
Carpatho Rusyns
2.7
/100
|
#249
Tragic
27.3%
Immigrants from Czechoslovakia
2.7
/100
|
#250
Tragic
27.3%
Immigrants from Norway
2.5
/100
|
#251
Tragic
27.3%
Ukrainians
2.4
/100
|
#252
Tragic
27.3%

Immigrants from the Azores Wage/Income Gap Correlation Summary

MeasurementImmigrants from the Azores DataWage/Income Gap Data
Minimum0.012%11.1%
Maximum9.1%74.6%
Range9.1%63.5%
Mean2.0%32.9%
Median1.4%28.4%
Interquartile 25% (IQ1)0.62%25.6%
Interquartile 75% (IQ3)2.4%39.0%
Interquartile Range (IQR)1.8%13.4%
Standard Deviation (Sample)2.1%14.0%
Standard Deviation (Population)2.0%13.8%

Correlation Details

Immigrants from the Azores PercentileSample SizeWage/Income Gap
[
0.0%
-
0.5%
]
0.012%
32,839,07223.2%
[
0.0%
-
0.5%
]
0.077%
6,960,83627.6%
[
0.0%
-
0.5%
]
0.13%
1,782,35529.5%
[
0.0%
-
0.5%
]
0.19%
1,140,18626.1%
[
0.0%
-
0.5%
]
0.24%
289,74726.4%
[
0.0%
-
0.5%
]
0.30%
752,63725.3%
[
0.0%
-
0.5%
]
0.36%
340,85931.8%
[
0.0%
-
0.5%
]
0.42%
118,92530.0%
[
0.0%
-
0.5%
]
0.47%
119,41625.8%
[
0.5%
-
1.0%
]
0.51%
244,88029.1%
[
0.5%
-
1.0%
]
0.59%
140,20825.6%
[
0.5%
-
1.0%
]
0.62%
244,82328.2%
[
0.5%
-
1.0%
]
0.70%
94,84030.0%
[
0.5%
-
1.0%
]
0.76%
180,49733.3%
[
0.5%
-
1.0%
]
0.80%
140,82528.6%
[
0.5%
-
1.0%
]
0.87%
41,09416.9%
[
0.5%
-
1.0%
]
0.90%
33,06618.9%
[
0.5%
-
1.0%
]
0.95%
194,60526.7%
[
1.0%
-
1.5%
]
1.03%
109,02027.7%
[
1.0%
-
1.5%
]
1.07%
24,29738.0%
[
1.0%
-
1.5%
]
1.19%
33638.6%
[
1.0%
-
1.5%
]
1.25%
4,46327.6%
[
1.0%
-
1.5%
]
1.28%
31,92728.4%
[
1.0%
-
1.5%
]
1.36%
11,43120.4%
[
1.0%
-
1.5%
]
1.43%
34974.6%
[
1.0%
-
1.5%
]
1.46%
15,90734.0%
[
1.0%
-
1.5%
]
1.49%
25,84727.3%
[
1.5%
-
2.0%
]
1.57%
7,15426.4%
[
1.5%
-
2.0%
]
1.65%
2,35940.1%
[
1.5%
-
2.0%
]
1.67%
3,66257.6%
[
1.5%
-
2.0%
]
1.82%
4,66049.0%
[
2.0%
-
2.5%
]
2.04%
17,15837.0%
[
2.0%
-
2.5%
]
2.11%
13,78161.7%
[
2.0%
-
2.5%
]
2.16%
5,59112.7%
[
2.0%
-
2.5%
]
2.36%
89162.3%
[
2.0%
-
2.5%
]
2.40%
22,42040.6%
[
2.5%
-
3.0%
]
2.55%
47,01214.4%
[
2.5%
-
3.0%
]
2.79%
3,62049.0%
[
3.0%
-
3.5%
]
3.19%
17,16439.0%
[
3.5%
-
4.0%
]
3.93%
53556.6%
[
4.0%
-
4.5%
]
4.15%
18,44540.8%
[
4.0%
-
4.5%
]
4.47%
131,56227.2%
[
4.5%
-
5.0%
]
4.61%
21,74211.1%
[
5.0%
-
5.5%
]
5.41%
30,55820.1%
[
7.0%
-
7.5%
]
7.15%
1,58158.0%
[
7.5%
-
8.0%
]
7.98%
8,76321.5%
[
9.0%
-
9.5%
]
9.13%
6,48420.4%