Immigrants from the Azores 4 or more Vehicles in Household

COMPARE

Immigrants from the Azores
Race
Ancestry
AfghanAfricanAlaska NativeAlaskan AthabascanAlbanianAleutAlsatianAmericanApacheArabArapahoArgentineanArmenianAssyrian/Chaldean/SyriacAustralianAustrianBahamianBangladeshiBarbadianBasqueBelgianBelizeanBermudanBhutaneseBlackfeetBolivianBrazilianBritishBritish West IndianBulgarianBurmeseCajunCambodianCanadianCape VerdeanCarpatho RusynCelticCentral AmericanCentral American IndianCherokeeCheyenneChickasawChileanChineseChippewaChoctawColombianColvilleComancheCosta RicanCreeCreekCroatianCrowCubanCypriotCzechCzechoslovakianDanishDelawareDominicanDutchDutch West IndianEastern EuropeanEcuadorianEgyptianEnglishEstonianEthiopianEuropeanFijianFilipinoFinnishFrenchFrench American IndianFrench CanadianGermanGerman RussianGhanaianGreekGuamanian/ChamorroGuatemalanGuyaneseHaitianHmongHonduranHopiHoumaHungarianIcelanderIndian (Asian)IndonesianInupiatIranianIraqiIrishIroquoisIsraeliItalianJamaicanJapaneseJordanianKenyanKiowaKoreanLaotianLatvianLebaneseLiberianLithuanianLumbeeLuxembourgerMacedonianMalaysianMalteseMarshalleseMenomineeMexicanMexican American IndianMongolianMoroccanNative HawaiianNavajoNepaleseNew ZealanderNicaraguanNigerianNorthern EuropeanNorwegianOkinawanOsageOttawaPaiutePakistaniPalestinianPanamanianParaguayanPennsylvania GermanPeruvianPimaPolishPortuguesePotawatomiPuebloPuerto RicanPuget Sound SalishRomanianRussianSalvadoranSamoanScandinavianScotch-IrishScottishSeminoleSenegaleseSerbianShoshoneSierra LeoneanSiouxSlavicSlovakSloveneSomaliSouth AfricanSouth AmericanSouth American IndianSoviet UnionSpaniardSpanishSpanish AmericanSpanish American IndianSri LankanSubsaharan AfricanSudaneseSwedishSwissSyrianTaiwaneseThaiTlingit-HaidaTohono O'OdhamTonganTrinidadian and TobagonianTsimshianTurkishU.S. Virgin IslanderUgandanUkrainianUruguayanUteVenezuelanVietnameseWelshWest IndianYakamaYaquiYugoslavianYumanYup'ikZimbabwean
Immigration
NonimmigrantsImmigrantsAfghanistanAfricaAlbaniaArgentinaArmeniaAsiaAustraliaAustriaBahamasBangladeshBarbadosBelarusBelgiumBelizeBoliviaBosnia and HerzegovinaBrazilBulgariaBurma/MyanmarCabo VerdeCambodiaCameroonCanadaCaribbeanCentral AmericaChileChinaColombiaCongoCosta RicaCroatiaCubaCzechoslovakiaDenmarkDominicaDominican RepublicEastern AfricaEastern AsiaEastern EuropeEcuadorEgyptEl SalvadorEnglandEritreaEthiopiaEuropeFijiFranceGermanyGhanaGreeceGrenadaGuatemalaGuyanaHaitiHondurasHong KongHungaryIndiaIndonesiaIranIraqIrelandIsraelItalyJamaicaJapanJordanKazakhstanKenyaKoreaKuwaitLaosLatin AmericaLatviaLebanonLiberiaLithuaniaMalaysiaMexicoMicronesiaMiddle AfricaMoldovaMoroccoNepalNetherlandsNicaraguaNigeriaNorth AmericaNorth MacedoniaNorthern AfricaNorthern EuropeNorwayOceaniaPakistanPanamaPeruPhilippinesPolandPortugalRomaniaRussiaSaudi ArabiaScotlandSenegalSerbiaSierra LeoneSingaporeSomaliaSouth AfricaSouth AmericaSouth Central AsiaSouth Eastern AsiaSouthern EuropeSpainSri LankaSt. Vincent and the GrenadinesSudanSwedenSwitzerlandSyriaTaiwanThailandTrinidad and TobagoTurkeyUgandaUkraineUruguayUzbekistanVenezuelaVietnamWest IndiesWestern AfricaWestern AsiaWestern EuropeYemenZaireZimbabweAzores
Select to Compare
Race
Ancestry
AfghanAfricanAlaska NativeAlaskan AthabascanAlbanianAleutAlsatianAmericanApacheArabArapahoArgentineanArmenianAssyrian/Chaldean/SyriacAustralianAustrianBahamianBangladeshiBarbadianBasqueBelgianBelizeanBermudanBhutaneseBlackfeetBolivianBrazilianBritishBritish West IndianBulgarianBurmeseCajunCambodianCanadianCape VerdeanCarpatho RusynCelticCentral AmericanCentral American IndianCherokeeCheyenneChickasawChileanChineseChippewaChoctawColombianColvilleComancheCosta RicanCreeCreekCroatianCrowCubanCypriotCzechCzechoslovakianDanishDelawareDominicanDutchDutch West IndianEastern EuropeanEcuadorianEgyptianEnglishEstonianEthiopianEuropeanFijianFilipinoFinnishFrenchFrench American IndianFrench CanadianGermanGerman RussianGhanaianGreekGuamanian/ChamorroGuatemalanGuyaneseHaitianHmongHonduranHopiHoumaHungarianIcelanderIndian (Asian)IndonesianInupiatIranianIraqiIrishIroquoisIsraeliItalianJamaicanJapaneseJordanianKenyanKiowaKoreanLaotianLatvianLebaneseLiberianLithuanianLumbeeLuxembourgerMacedonianMalaysianMalteseMarshalleseMenomineeMexicanMexican American IndianMongolianMoroccanNative HawaiianNavajoNepaleseNew ZealanderNicaraguanNigerianNorthern EuropeanNorwegianOkinawanOsageOttawaPaiutePakistaniPalestinianPanamanianParaguayanPennsylvania GermanPeruvianPimaPolishPortuguesePotawatomiPuebloPuerto RicanPuget Sound SalishRomanianRussianSalvadoranSamoanScandinavianScotch-IrishScottishSeminoleSenegaleseSerbianShoshoneSierra LeoneanSiouxSlavicSlovakSloveneSomaliSouth AfricanSouth AmericanSouth American IndianSoviet UnionSpaniardSpanishSpanish AmericanSpanish American IndianSri LankanSubsaharan AfricanSudaneseSwedishSwissSyrianTaiwaneseThaiTlingit-HaidaTohono O'OdhamTonganTrinidadian and TobagonianTsimshianTurkishU.S. Virgin IslanderUgandanUkrainianUruguayanUteVenezuelanVietnameseWelshWest IndianYakamaYaquiYugoslavianYumanYup'ikZimbabwean
Immigration
NonimmigrantsImmigrantsAfghanistanAfricaAlbaniaArgentinaArmeniaAsiaAustraliaAustriaBahamasBangladeshBarbadosBelarusBelgiumBelizeBoliviaBosnia and HerzegovinaBrazilBulgariaBurma/MyanmarCabo VerdeCambodiaCameroonCanadaCaribbeanCentral AmericaChileChinaColombiaCongoCosta RicaCroatiaCubaCzechoslovakiaDenmarkDominicaDominican RepublicEastern AfricaEastern AsiaEastern EuropeEcuadorEgyptEl SalvadorEnglandEritreaEthiopiaEuropeFijiFranceGermanyGhanaGreeceGrenadaGuatemalaGuyanaHaitiHondurasHong KongHungaryIndiaIndonesiaIranIraqIrelandIsraelItalyJamaicaJapanJordanKazakhstanKenyaKoreaKuwaitLaosLatin AmericaLatviaLebanonLiberiaLithuaniaMalaysiaMexicoMicronesiaMiddle AfricaMoldovaMoroccoNepalNetherlandsNicaraguaNigeriaNorth AmericaNorth MacedoniaNorthern AfricaNorthern EuropeNorwayOceaniaPakistanPanamaPeruPhilippinesPolandPortugalRomaniaRussiaSaudi ArabiaScotlandSenegalSerbiaSierra LeoneSingaporeSomaliaSouth AfricaSouth AmericaSouth Central AsiaSouth Eastern AsiaSouthern EuropeSpainSri LankaSt. Vincent and the GrenadinesSudanSwedenSwitzerlandSyriaTaiwanThailandTrinidad and TobagoTurkeyUgandaUkraineUruguayUzbekistanVenezuelaVietnamWest IndiesWestern AfricaWestern AsiaWestern EuropeYemenZaireZimbabwe
4 or more Vehicles in Household
Income
Poverty
Unemployment
Labor Participation
Family Structure
Vehicle Availability
Education Level
Disability

Immigrants from the Azores 4 or more Vehicles in Household
Exceptional

7.5%
4+ VEHICLES AVAILABLE
100.0/ 100
METRIC RATING
65th/ 347
METRIC RANK

Immigrants from the Azores 4 or more Vehicles in Household Correlation Chart

The statistical analysis conducted on geographies consisting of 46,225,875 people shows a mild positive correlation between the proportion of Immigrants from the Azores and percentage of households with 4 or more vehicles available in the United States with a correlation coefficient (R) of 0.368 and weighted average of 7.5%. On average, for every 1% (one percent) increase in Immigrants from the Azores within a typical geography, there is an increase of 0.71% in percentage of households with 4 or more vehicles available.
Immigrants from the Azores 4 or more Vehicles in Household
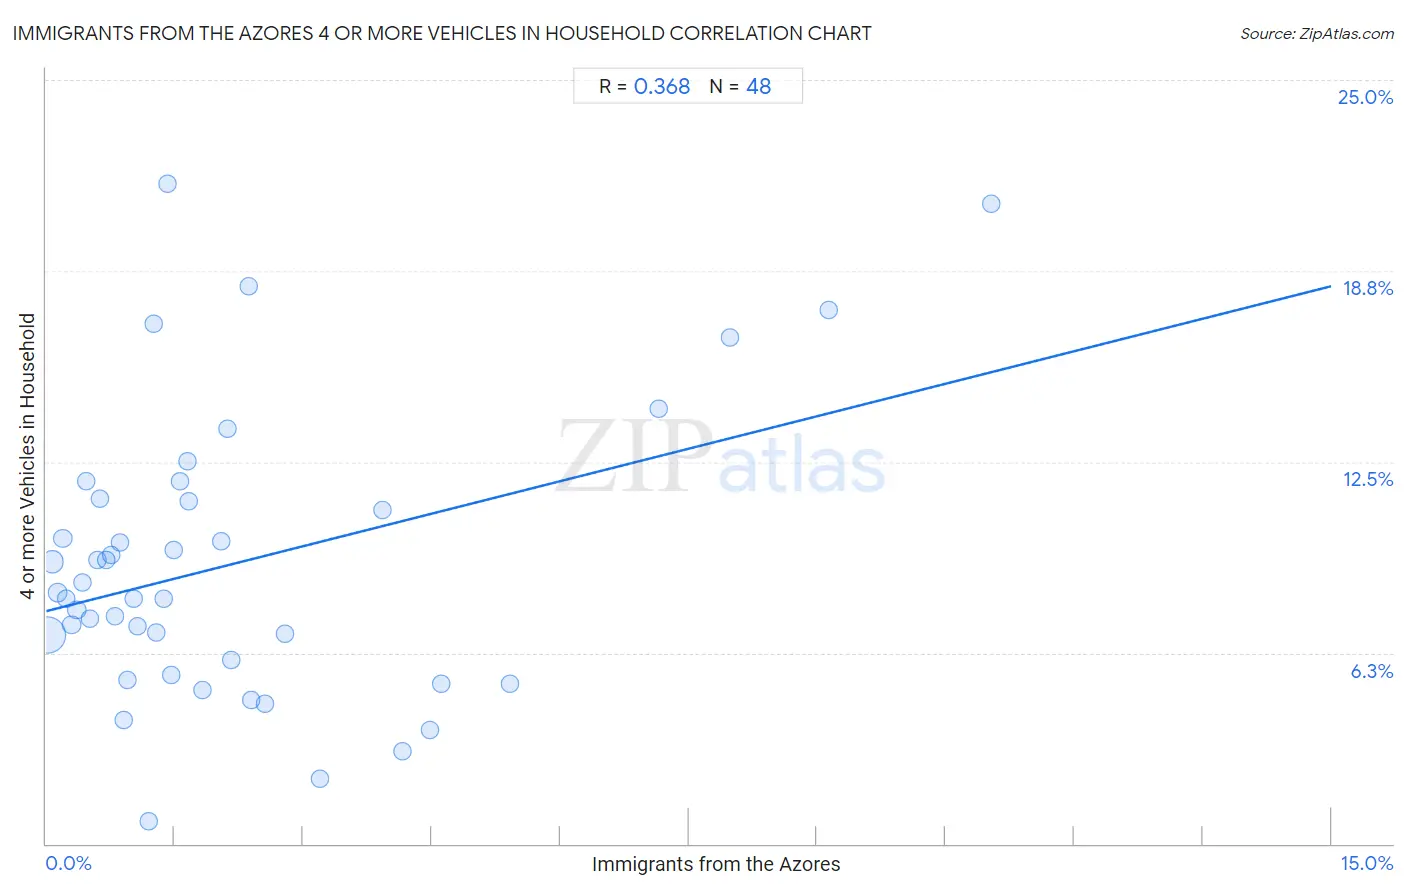
It is essential to understand that the correlation between the percentage of Immigrants from the Azores and percentage of households with 4 or more vehicles available does not imply a direct cause-and-effect relationship. It remains uncertain whether the presence of Immigrants from the Azores influences an upward or downward trend in the level of percentage of households with 4 or more vehicles available within an area, or if Immigrants from the Azores simply ended up residing in those areas with higher or lower levels of percentage of households with 4 or more vehicles available due to other factors.

Demographics Similar to Immigrants from the Azores by 4 or more Vehicles in Household

In terms of 4 or more vehicles in household, the demographic groups most similar to Immigrants from the Azores are Bangladeshi (7.6%, a difference of 0.040%), Immigrants from Micronesia (7.6%, a difference of 0.28%), Chippewa (7.6%, a difference of 0.29%), Immigrants from Taiwan (7.5%, a difference of 0.33%), and American (7.5%, a difference of 0.34%).
DemographicsRating | Rank4 or more Vehicles in Household
Swedes
100.0
/100
|
#58
Exceptional
7.6%
Hispanics or Latinos
100.0
/100
|
#59
Exceptional
7.6%
Spaniards
100.0
/100
|
#60
Exceptional
7.6%
Europeans
100.0
/100
|
#61
Exceptional
7.6%
Chippewa
100.0
/100
|
#62
Exceptional
7.6%
Immigrants from Micronesia
100.0
/100
|
#63
Exceptional
7.6%
Bangladeshis
100.0
/100
|
#64
Exceptional
7.6%
Immigrants from the Azores
100.0
/100
|
#65
Exceptional
7.5%
Immigrants from Taiwan
99.9
/100
|
#66
Exceptional
7.5%
Americans
99.9
/100
|
#67
Exceptional
7.5%
Welsh
99.9
/100
|
#68
Exceptional
7.5%
Germans
99.9
/100
|
#69
Exceptional
7.5%
Scottish
99.9
/100
|
#70
Exceptional
7.4%
Chickasaw
99.9
/100
|
#71
Exceptional
7.4%
Scotch-Irish
99.9
/100
|
#72
Exceptional
7.4%

Immigrants from the Azores 4 or more Vehicles in Household Correlation Summary

MeasurementImmigrants from the Azores Data4 or more Vehicles in Household Data
Minimum0.012%0.74%
Maximum11.0%21.6%
Range11.0%20.9%
Mean2.2%9.2%
Median1.4%8.1%
Interquartile 25% (IQ1)0.66%5.8%
Interquartile 75% (IQ3)2.5%11.3%
Interquartile Range (IQR)1.8%5.5%
Standard Deviation (Sample)2.4%4.7%
Standard Deviation (Population)2.4%4.6%

Correlation Details

Immigrants from the Azores PercentileSample Size4 or more Vehicles in Household
[
0.0%
-
0.5%
]
0.012%
32,827,0336.8%
[
0.0%
-
0.5%
]
0.077%
6,962,8599.2%
[
0.0%
-
0.5%
]
0.13%
1,769,8658.2%
[
0.0%
-
0.5%
]
0.19%
1,140,18610.0%
[
0.0%
-
0.5%
]
0.24%
289,7478.0%
[
0.0%
-
0.5%
]
0.30%
753,3017.2%
[
0.0%
-
0.5%
]
0.36%
342,9147.6%
[
0.0%
-
0.5%
]
0.42%
119,3918.6%
[
0.0%
-
0.5%
]
0.47%
119,41611.9%
[
0.5%
-
1.0%
]
0.51%
244,8807.4%
[
0.5%
-
1.0%
]
0.59%
140,5659.3%
[
0.5%
-
1.0%
]
0.62%
244,82311.3%
[
0.5%
-
1.0%
]
0.70%
94,8409.3%
[
0.5%
-
1.0%
]
0.76%
180,6309.5%
[
0.5%
-
1.0%
]
0.80%
140,8257.5%
[
0.5%
-
1.0%
]
0.87%
41,0949.9%
[
0.5%
-
1.0%
]
0.90%
33,0664.1%
[
0.5%
-
1.0%
]
0.95%
190,8045.3%
[
1.0%
-
1.5%
]
1.03%
109,0208.0%
[
1.0%
-
1.5%
]
1.07%
24,2977.1%
[
1.0%
-
1.5%
]
1.19%
3360.74%
[
1.0%
-
1.5%
]
1.25%
4,46317.0%
[
1.0%
-
1.5%
]
1.28%
32,1566.9%
[
1.0%
-
1.5%
]
1.36%
11,4318.0%
[
1.0%
-
1.5%
]
1.42%
77421.6%
[
1.0%
-
1.5%
]
1.46%
15,9075.5%
[
1.0%
-
1.5%
]
1.49%
25,8479.6%
[
1.5%
-
2.0%
]
1.57%
7,15411.9%
[
1.5%
-
2.0%
]
1.65%
2,35912.5%
[
1.5%
-
2.0%
]
1.67%
3,66211.2%
[
1.5%
-
2.0%
]
1.82%
4,6605.0%
[
2.0%
-
2.5%
]
2.04%
17,1589.9%
[
2.0%
-
2.5%
]
2.11%
13,78113.6%
[
2.0%
-
2.5%
]
2.16%
5,5916.0%
[
2.0%
-
2.5%
]
2.36%
89118.2%
[
2.0%
-
2.5%
]
2.40%
22,4204.7%
[
2.5%
-
3.0%
]
2.55%
47,0124.6%
[
2.5%
-
3.0%
]
2.79%
3,6206.9%
[
3.0%
-
3.5%
]
3.19%
17,1642.1%
[
3.5%
-
4.0%
]
3.93%
53510.9%
[
4.0%
-
4.5%
]
4.15%
18,4453.0%
[
4.0%
-
4.5%
]
4.47%
131,5623.7%
[
4.5%
-
5.0%
]
4.61%
21,7425.2%
[
5.0%
-
5.5%
]
5.41%
30,5585.2%
[
7.0%
-
7.5%
]
7.15%
1,58114.2%
[
7.5%
-
8.0%
]
7.98%
8,76316.6%
[
9.0%
-
9.5%
]
9.13%
6,48417.5%
[
11.0%
-
11.5%
]
11.03%
26321.0%