Hungarian 3 or more Vehicles in Household
COMPARE
Hungarian
Select to Compare
3 or more Vehicles in Household
Hungarian 3 or more Vehicles in Household
19.8%
3+ VEHICLES AVAILABLE
70.5/ 100
METRIC RATING
157th/ 347
METRIC RANK
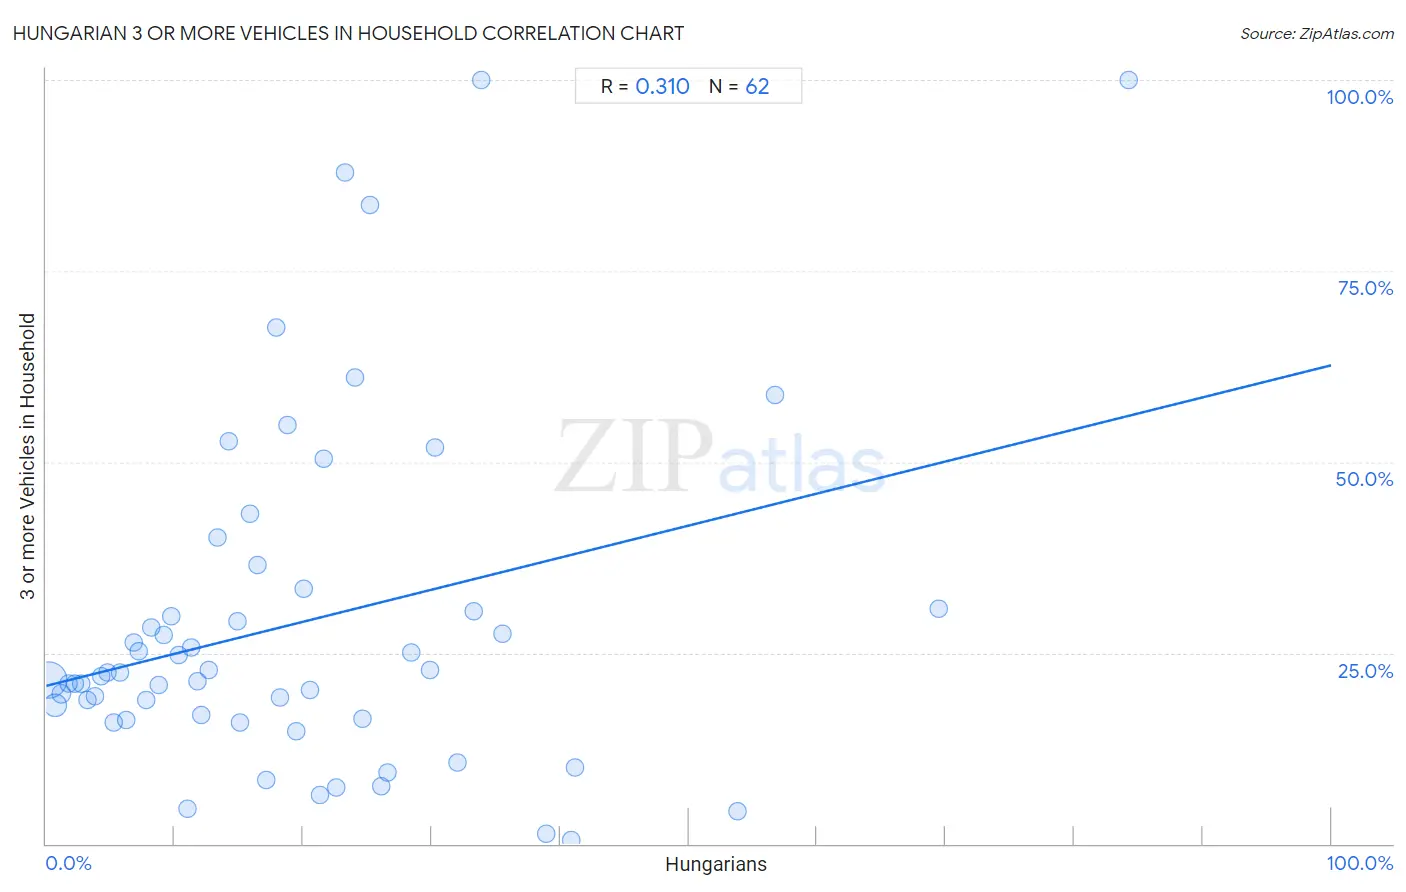
Hungarian 3 or more Vehicles in Household Correlation Chart
The statistical analysis conducted on geographies consisting of 485,698,849 people shows a mild positive correlation between the proportion of Hungarians and percentage of households with 3 or more vehicles available in the United States with a correlation coefficient (R) of 0.310 and weighted average of 19.8%. On average, for every 1% (one percent) increase in Hungarians within a typical geography, there is an increase of 0.42% in percentage of households with 3 or more vehicles available.
It is essential to understand that the correlation between the percentage of Hungarians and percentage of households with 3 or more vehicles available does not imply a direct cause-and-effect relationship. It remains uncertain whether the presence of Hungarians influences an upward or downward trend in the level of percentage of households with 3 or more vehicles available within an area, or if Hungarians simply ended up residing in those areas with higher or lower levels of percentage of households with 3 or more vehicles available due to other factors.
Demographics Similar to Hungarians by 3 or more Vehicles in Household
In terms of 3 or more vehicles in household, the demographic groups most similar to Hungarians are Thai (19.8%, a difference of 0.050%), Armenian (19.8%, a difference of 0.15%), Immigrants from Pakistan (19.8%, a difference of 0.21%), Tlingit-Haida (19.9%, a difference of 0.26%), and Immigrants from Lebanon (19.8%, a difference of 0.26%).
| Demographics | Rating | Rank | 3 or more Vehicles in Household |
| Immigrants | 80.8 /100 | #150 | Excellent 20.0% |
| Taiwanese | 80.6 /100 | #151 | Excellent 20.0% |
| Lebanese | 79.8 /100 | #152 | Good 20.0% |
| Yuman | 75.6 /100 | #153 | Good 19.9% |
| Immigrants from Jordan | 75.0 /100 | #154 | Good 19.9% |
| Tlingit-Haida | 73.4 /100 | #155 | Good 19.9% |
| Thais | 71.1 /100 | #156 | Good 19.8% |
| Hungarians | 70.5 /100 | #157 | Good 19.8% |
| Armenians | 68.8 /100 | #158 | Good 19.8% |
| Immigrants from Pakistan | 68.2 /100 | #159 | Good 19.8% |
| Immigrants from Lebanon | 67.6 /100 | #160 | Good 19.8% |
| Immigrants from Guatemala | 65.6 /100 | #161 | Good 19.7% |
| Estonians | 63.2 /100 | #162 | Good 19.7% |
| Chileans | 63.0 /100 | #163 | Good 19.7% |
| Yugoslavians | 62.9 /100 | #164 | Good 19.7% |
Hungarian 3 or more Vehicles in Household Correlation Summary
| Measurement | Hungarian Data | 3 or more Vehicles in Household Data |
| Minimum | 0.21% | 0.54% |
| Maximum | 84.3% | 100.0% |
| Range | 84.0% | 99.5% |
| Mean | 19.6% | 28.9% |
| Median | 16.1% | 22.2% |
| Interquartile 25% (IQ1) | 7.7% | 16.4% |
| Interquartile 75% (IQ3) | 26.0% | 30.8% |
| Interquartile Range (IQR) | 18.3% | 14.4% |
| Standard Deviation (Sample) | 16.6% | 22.4% |
| Standard Deviation (Population) | 16.4% | 22.2% |
Correlation Details
| Hungarian Percentile | Sample Size | 3 or more Vehicles in Household |
[ 0.0% - 0.5% ] 0.21% | 357,015,868 | 21.4% |
[ 0.5% - 1.0% ] 0.68% | 85,696,819 | 18.2% |
[ 1.0% - 1.5% ] 1.20% | 21,840,202 | 19.6% |
[ 1.5% - 2.0% ] 1.73% | 8,692,505 | 21.0% |
[ 2.0% - 2.5% ] 2.23% | 4,099,622 | 20.9% |
[ 2.5% - 3.0% ] 2.75% | 2,276,270 | 21.0% |
[ 3.0% - 3.5% ] 3.24% | 1,849,917 | 18.9% |
[ 3.5% - 4.0% ] 3.77% | 1,315,365 | 19.3% |
[ 4.0% - 4.5% ] 4.26% | 907,936 | 21.9% |
[ 4.5% - 5.0% ] 4.74% | 463,093 | 22.5% |
[ 5.0% - 5.5% ] 5.28% | 440,527 | 15.9% |
[ 5.5% - 6.0% ] 5.78% | 156,266 | 22.5% |
[ 6.0% - 6.5% ] 6.22% | 148,746 | 16.2% |
[ 6.5% - 7.0% ] 6.77% | 118,894 | 26.3% |
[ 7.0% - 7.5% ] 7.18% | 84,345 | 25.2% |
[ 7.5% - 8.0% ] 7.75% | 71,172 | 18.9% |
[ 8.0% - 8.5% ] 8.21% | 48,301 | 28.3% |
[ 8.5% - 9.0% ] 8.71% | 28,645 | 20.7% |
[ 9.0% - 9.5% ] 9.16% | 20,347 | 27.4% |
[ 9.5% - 10.0% ] 9.72% | 13,528 | 29.7% |
[ 10.0% - 10.5% ] 10.32% | 6,038 | 24.7% |
[ 10.5% - 11.0% ] 10.94% | 55,636 | 4.5% |
[ 11.0% - 11.5% ] 11.30% | 26,068 | 25.8% |
[ 11.5% - 12.0% ] 11.76% | 18,859 | 21.3% |
[ 12.0% - 12.5% ] 12.06% | 77,181 | 16.8% |
[ 12.5% - 13.0% ] 12.67% | 2,722 | 22.8% |
[ 13.0% - 13.5% ] 13.33% | 2,595 | 40.1% |
[ 14.0% - 14.5% ] 14.22% | 436 | 52.8% |
[ 14.5% - 15.0% ] 14.92% | 362 | 29.2% |
[ 15.0% - 15.5% ] 15.05% | 7,051 | 16.0% |
[ 15.5% - 16.0% ] 15.85% | 164 | 43.2% |
[ 16.0% - 16.5% ] 16.42% | 134 | 36.5% |
[ 17.0% - 17.5% ] 17.14% | 49,883 | 8.3% |
[ 17.5% - 18.0% ] 17.94% | 853 | 67.6% |
[ 18.0% - 18.5% ] 18.23% | 1,871 | 19.2% |
[ 18.5% - 19.0% ] 18.80% | 947 | 54.8% |
[ 19.0% - 19.5% ] 19.42% | 1,792 | 14.8% |
[ 20.0% - 20.5% ] 20.00% | 35 | 33.4% |
[ 20.0% - 20.5% ] 20.49% | 610 | 20.2% |
[ 21.0% - 21.5% ] 21.34% | 28,607 | 6.3% |
[ 21.5% - 22.0% ] 21.57% | 2,035 | 50.5% |
[ 22.5% - 23.0% ] 22.53% | 7,385 | 7.4% |
[ 23.0% - 23.5% ] 23.21% | 224 | 87.9% |
[ 24.0% - 24.5% ] 24.00% | 125 | 61.0% |
[ 24.5% - 25.0% ] 24.63% | 64,313 | 16.4% |
[ 25.0% - 25.5% ] 25.23% | 959 | 83.6% |
[ 26.0% - 26.5% ] 26.04% | 864 | 7.6% |
[ 26.5% - 27.0% ] 26.60% | 188 | 9.4% |
[ 28.0% - 28.5% ] 28.39% | 236 | 25.0% |
[ 29.5% - 30.0% ] 29.82% | 959 | 22.8% |
[ 30.0% - 30.5% ] 30.23% | 258 | 51.9% |
[ 31.5% - 32.0% ] 31.96% | 3,858 | 10.7% |
[ 33.0% - 33.5% ] 33.30% | 871 | 30.4% |
[ 33.5% - 34.0% ] 33.83% | 133 | 100.0% |
[ 35.5% - 36.0% ] 35.53% | 76 | 27.5% |
[ 38.5% - 39.0% ] 38.95% | 9,614 | 1.3% |
[ 40.5% - 41.0% ] 40.81% | 34,544 | 0.54% |
[ 41.0% - 41.5% ] 41.12% | 1,481 | 10.1% |
[ 53.5% - 54.0% ] 53.76% | 173 | 4.3% |
[ 56.5% - 57.0% ] 56.67% | 60 | 58.8% |
[ 69.0% - 69.5% ] 69.48% | 154 | 30.8% |
[ 84.0% - 84.5% ] 84.25% | 127 | 100.0% |