Hungarian 4 or more Vehicles in Household

COMPARE

Hungarian
Race
Ancestry
AfghanAfricanAlaska NativeAlaskan AthabascanAlbanianAleutAlsatianAmericanApacheArabArapahoArgentineanArmenianAssyrian/Chaldean/SyriacAustralianAustrianBahamianBangladeshiBarbadianBasqueBelgianBelizeanBermudanBhutaneseBlackfeetBolivianBrazilianBritishBritish West IndianBulgarianBurmeseCajunCambodianCanadianCape VerdeanCarpatho RusynCelticCentral AmericanCentral American IndianCherokeeCheyenneChickasawChileanChineseChippewaChoctawColombianColvilleComancheCosta RicanCreeCreekCroatianCrowCubanCypriotCzechCzechoslovakianDanishDelawareDominicanDutchDutch West IndianEastern EuropeanEcuadorianEgyptianEnglishEstonianEthiopianEuropeanFijianFilipinoFinnishFrenchFrench American IndianFrench CanadianGermanGerman RussianGhanaianGreekGuamanian/ChamorroGuatemalanGuyaneseHaitianHmongHonduranHopiHoumaHungarianIcelanderIndian (Asian)IndonesianInupiatIranianIraqiIrishIroquoisIsraeliItalianJamaicanJapaneseJordanianKenyanKiowaKoreanLaotianLatvianLebaneseLiberianLithuanianLumbeeLuxembourgerMacedonianMalaysianMalteseMarshalleseMenomineeMexicanMexican American IndianMongolianMoroccanNative HawaiianNavajoNepaleseNew ZealanderNicaraguanNigerianNorthern EuropeanNorwegianOkinawanOsageOttawaPaiutePakistaniPalestinianPanamanianParaguayanPennsylvania GermanPeruvianPimaPolishPortuguesePotawatomiPuebloPuerto RicanPuget Sound SalishRomanianRussianSalvadoranSamoanScandinavianScotch-IrishScottishSeminoleSenegaleseSerbianShoshoneSierra LeoneanSiouxSlavicSlovakSloveneSomaliSouth AfricanSouth AmericanSouth American IndianSoviet UnionSpaniardSpanishSpanish AmericanSpanish American IndianSri LankanSubsaharan AfricanSudaneseSwedishSwissSyrianTaiwaneseThaiTlingit-HaidaTohono O'OdhamTonganTrinidadian and TobagonianTsimshianTurkishU.S. Virgin IslanderUgandanUkrainianUruguayanUteVenezuelanVietnameseWelshWest IndianYakamaYaquiYugoslavianYumanYup'ikZimbabwean
Immigration
NonimmigrantsImmigrantsAfghanistanAfricaAlbaniaArgentinaArmeniaAsiaAustraliaAustriaBahamasBangladeshBarbadosBelarusBelgiumBelizeBoliviaBosnia and HerzegovinaBrazilBulgariaBurma/MyanmarCabo VerdeCambodiaCameroonCanadaCaribbeanCentral AmericaChileChinaColombiaCongoCosta RicaCroatiaCubaCzechoslovakiaDenmarkDominicaDominican RepublicEastern AfricaEastern AsiaEastern EuropeEcuadorEgyptEl SalvadorEnglandEritreaEthiopiaEuropeFijiFranceGermanyGhanaGreeceGrenadaGuatemalaGuyanaHaitiHondurasHong KongHungaryIndiaIndonesiaIranIraqIrelandIsraelItalyJamaicaJapanJordanKazakhstanKenyaKoreaKuwaitLaosLatin AmericaLatviaLebanonLiberiaLithuaniaMalaysiaMexicoMicronesiaMiddle AfricaMoldovaMoroccoNepalNetherlandsNicaraguaNigeriaNorth AmericaNorth MacedoniaNorthern AfricaNorthern EuropeNorwayOceaniaPakistanPanamaPeruPhilippinesPolandPortugalRomaniaRussiaSaudi ArabiaScotlandSenegalSerbiaSierra LeoneSingaporeSomaliaSouth AfricaSouth AmericaSouth Central AsiaSouth Eastern AsiaSouthern EuropeSpainSri LankaSt. Vincent and the GrenadinesSudanSwedenSwitzerlandSyriaTaiwanThailandTrinidad and TobagoTurkeyUgandaUkraineUruguayUzbekistanVenezuelaVietnamWest IndiesWestern AfricaWestern AsiaWestern EuropeYemenZaireZimbabweAzores
Select to Compare
Race
Ancestry
AfghanAfricanAlaska NativeAlaskan AthabascanAlbanianAleutAlsatianAmericanApacheArabArapahoArgentineanArmenianAssyrian/Chaldean/SyriacAustralianAustrianBahamianBangladeshiBarbadianBasqueBelgianBelizeanBermudanBhutaneseBlackfeetBolivianBrazilianBritishBritish West IndianBulgarianBurmeseCajunCambodianCanadianCape VerdeanCarpatho RusynCelticCentral AmericanCentral American IndianCherokeeCheyenneChickasawChileanChineseChippewaChoctawColombianColvilleComancheCosta RicanCreeCreekCroatianCrowCubanCypriotCzechCzechoslovakianDanishDelawareDominicanDutchDutch West IndianEastern EuropeanEcuadorianEgyptianEnglishEstonianEthiopianEuropeanFijianFilipinoFinnishFrenchFrench American IndianFrench CanadianGermanGerman RussianGhanaianGreekGuamanian/ChamorroGuatemalanGuyaneseHaitianHmongHonduranHopiHoumaIcelanderIndian (Asian)IndonesianInupiatIranianIraqiIrishIroquoisIsraeliItalianJamaicanJapaneseJordanianKenyanKiowaKoreanLaotianLatvianLebaneseLiberianLithuanianLumbeeLuxembourgerMacedonianMalaysianMalteseMarshalleseMenomineeMexicanMexican American IndianMongolianMoroccanNative HawaiianNavajoNepaleseNew ZealanderNicaraguanNigerianNorthern EuropeanNorwegianOkinawanOsageOttawaPaiutePakistaniPalestinianPanamanianParaguayanPennsylvania GermanPeruvianPimaPolishPortuguesePotawatomiPuebloPuerto RicanPuget Sound SalishRomanianRussianSalvadoranSamoanScandinavianScotch-IrishScottishSeminoleSenegaleseSerbianShoshoneSierra LeoneanSiouxSlavicSlovakSloveneSomaliSouth AfricanSouth AmericanSouth American IndianSoviet UnionSpaniardSpanishSpanish AmericanSpanish American IndianSri LankanSubsaharan AfricanSudaneseSwedishSwissSyrianTaiwaneseThaiTlingit-HaidaTohono O'OdhamTonganTrinidadian and TobagonianTsimshianTurkishU.S. Virgin IslanderUgandanUkrainianUruguayanUteVenezuelanVietnameseWelshWest IndianYakamaYaquiYugoslavianYumanYup'ikZimbabwean
Immigration
NonimmigrantsImmigrantsAfghanistanAfricaAlbaniaArgentinaArmeniaAsiaAustraliaAustriaBahamasBangladeshBarbadosBelarusBelgiumBelizeBoliviaBosnia and HerzegovinaBrazilBulgariaBurma/MyanmarCabo VerdeCambodiaCameroonCanadaCaribbeanCentral AmericaChileChinaColombiaCongoCosta RicaCroatiaCubaCzechoslovakiaDenmarkDominicaDominican RepublicEastern AfricaEastern AsiaEastern EuropeEcuadorEgyptEl SalvadorEnglandEritreaEthiopiaEuropeFijiFranceGermanyGhanaGreeceGrenadaGuatemalaGuyanaHaitiHondurasHong KongHungaryIndiaIndonesiaIranIraqIrelandIsraelItalyJamaicaJapanJordanKazakhstanKenyaKoreaKuwaitLaosLatin AmericaLatviaLebanonLiberiaLithuaniaMalaysiaMexicoMicronesiaMiddle AfricaMoldovaMoroccoNepalNetherlandsNicaraguaNigeriaNorth AmericaNorth MacedoniaNorthern AfricaNorthern EuropeNorwayOceaniaPakistanPanamaPeruPhilippinesPolandPortugalRomaniaRussiaSaudi ArabiaScotlandSenegalSerbiaSierra LeoneSingaporeSomaliaSouth AfricaSouth AmericaSouth Central AsiaSouth Eastern AsiaSouthern EuropeSpainSri LankaSt. Vincent and the GrenadinesSudanSwedenSwitzerlandSyriaTaiwanThailandTrinidad and TobagoTurkeyUgandaUkraineUruguayUzbekistanVenezuelaVietnamWest IndiesWestern AfricaWestern AsiaWestern EuropeYemenZaireZimbabweAzores
4 or more Vehicles in Household
Income
Poverty
Unemployment
Labor Participation
Family Structure
Vehicle Availability
Education Level
Disability

Hungarian 4 or more Vehicles in Household
Good

6.4%
4+ VEHICLES AVAILABLE
61.1/ 100
METRIC RATING
164th/ 347
METRIC RANK

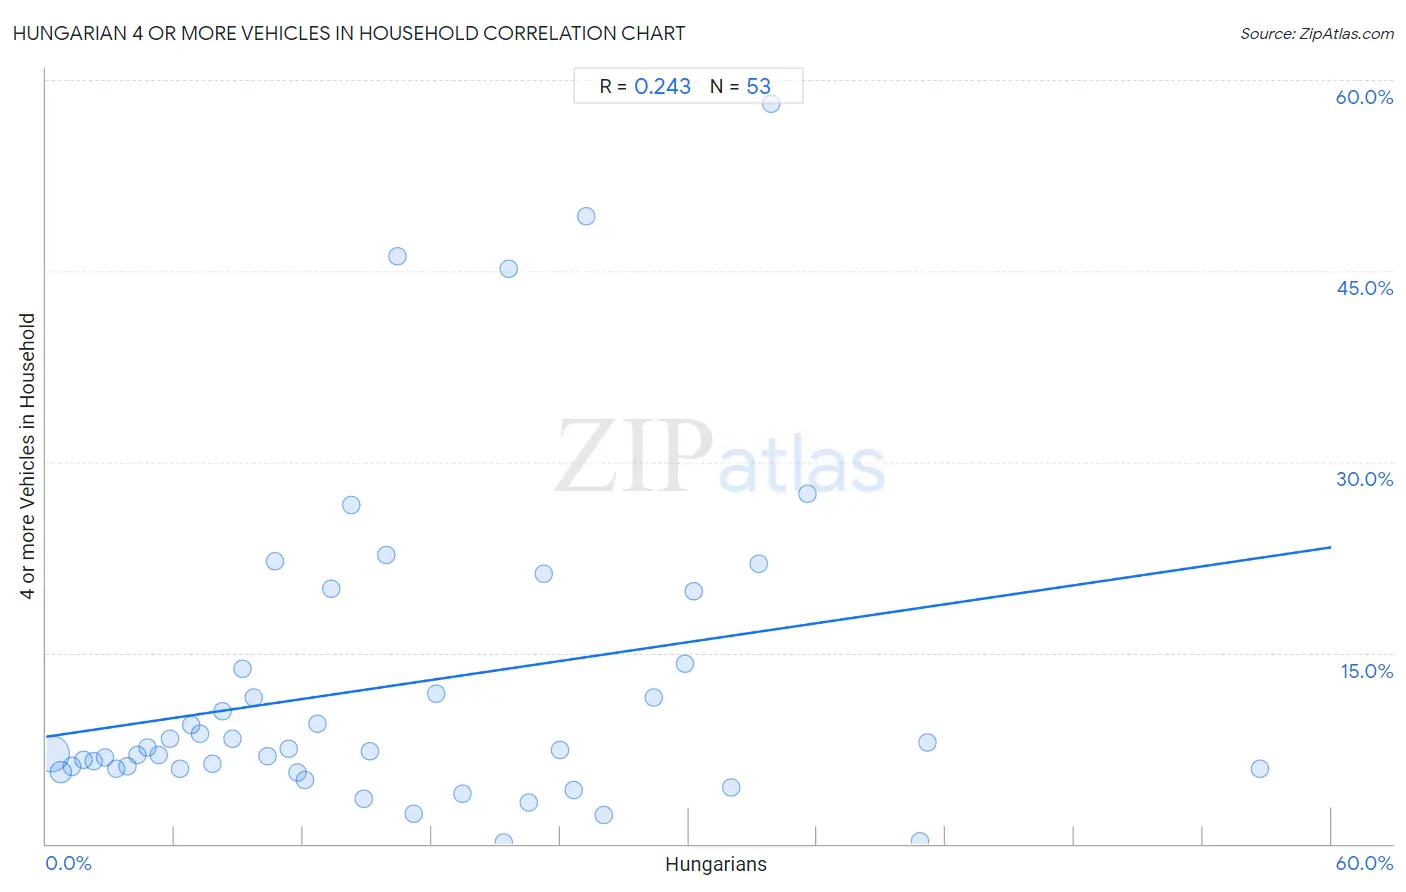
Hungarian 4 or more Vehicles in Household Correlation Chart

The statistical analysis conducted on geographies consisting of 483,846,610 people shows a weak positive correlation between the proportion of Hungarians and percentage of households with 4 or more vehicles available in the United States with a correlation coefficient (R) of 0.243 and weighted average of 6.4%. On average, for every 1% (one percent) increase in Hungarians within a typical geography, there is an increase of 0.25% in percentage of households with 4 or more vehicles available.
Hungarian 4 or more Vehicles in Household
It is essential to understand that the correlation between the percentage of Hungarians and percentage of households with 4 or more vehicles available does not imply a direct cause-and-effect relationship. It remains uncertain whether the presence of Hungarians influences an upward or downward trend in the level of percentage of households with 4 or more vehicles available within an area, or if Hungarians simply ended up residing in those areas with higher or lower levels of percentage of households with 4 or more vehicles available due to other factors.

Demographics Similar to Hungarians by 4 or more Vehicles in Household

In terms of 4 or more vehicles in household, the demographic groups most similar to Hungarians are Chilean (6.4%, a difference of 0.010%), Immigrants from Peru (6.4%, a difference of 0.14%), Immigrants from Pakistan (6.4%, a difference of 0.22%), Immigrants from Cameroon (6.4%, a difference of 0.35%), and Immigrants from Denmark (6.4%, a difference of 0.35%).
DemographicsRating | Rank4 or more Vehicles in Household
Peruvians
69.4
/100
|
#157
Good
6.5%
Zimbabweans
67.1
/100
|
#158
Good
6.4%
Indians (Asian)
66.3
/100
|
#159
Good
6.4%
Palestinians
65.8
/100
|
#160
Good
6.4%
Immigrants from Cameroon
64.4
/100
|
#161
Good
6.4%
Immigrants from Pakistan
63.2
/100
|
#162
Good
6.4%
Chileans
61.2
/100
|
#163
Good
6.4%
Hungarians
61.1
/100
|
#164
Good
6.4%
Immigrants from Peru
59.8
/100
|
#165
Average
6.4%
Immigrants from Denmark
57.8
/100
|
#166
Average
6.4%
Poles
56.9
/100
|
#167
Average
6.4%
Lebanese
55.8
/100
|
#168
Average
6.4%
Estonians
55.1
/100
|
#169
Average
6.4%
Immigrants from Syria
52.8
/100
|
#170
Average
6.3%
Immigrants from India
51.9
/100
|
#171
Average
6.3%

Hungarian 4 or more Vehicles in Household Correlation Summary

MeasurementHungarian Data4 or more Vehicles in Household Data
Minimum0.21%0.062%
Maximum56.7%58.1%
Range56.5%58.1%
Mean16.3%12.4%
Median13.3%7.3%
Interquartile 25% (IQ1)6.5%5.9%
Interquartile 75% (IQ3)24.3%13.9%
Interquartile Range (IQR)17.8%8.0%
Standard Deviation (Sample)12.3%12.6%
Standard Deviation (Population)12.2%12.5%

Correlation Details

Hungarian PercentileSample Size4 or more Vehicles in Household
[
0.0%
-
0.5%
]
0.21%
356,183,2037.1%
[
0.5%
-
1.0%
]
0.68%
85,291,4535.6%
[
1.0%
-
1.5%
]
1.20%
21,534,4226.1%
[
1.5%
-
2.0%
]
1.73%
8,652,1106.6%
[
2.0%
-
2.5%
]
2.23%
4,076,5826.5%
[
2.5%
-
3.0%
]
2.75%
2,243,5506.8%
[
3.0%
-
3.5%
]
3.24%
1,843,4015.9%
[
3.5%
-
4.0%
]
3.77%
1,306,1466.0%
[
4.0%
-
4.5%
]
4.26%
901,9827.0%
[
4.5%
-
5.0%
]
4.74%
457,2127.5%
[
5.0%
-
5.5%
]
5.25%
346,5006.9%
[
5.5%
-
6.0%
]
5.78%
153,1388.3%
[
6.0%
-
6.5%
]
6.22%
147,0305.9%
[
6.5%
-
7.0%
]
6.77%
118,5899.3%
[
7.0%
-
7.5%
]
7.18%
81,6358.6%
[
7.5%
-
8.0%
]
7.75%
70,0426.2%
[
8.0%
-
8.5%
]
8.21%
46,59410.4%
[
8.5%
-
9.0%
]
8.71%
27,4338.2%
[
9.0%
-
9.5%
]
9.16%
19,93113.7%
[
9.5%
-
10.0%
]
9.70%
11,23011.5%
[
10.0%
-
10.5%
]
10.34%
4,4686.9%
[
10.5%
-
11.0%
]
10.65%
4,23422.2%
[
11.0%
-
11.5%
]
11.30%
26,0687.4%
[
11.5%
-
12.0%
]
11.76%
18,6335.6%
[
12.0%
-
12.5%
]
12.06%
76,5105.0%
[
12.5%
-
13.0%
]
12.67%
2,7229.4%
[
13.0%
-
13.5%
]
13.33%
2,59520.1%
[
14.0%
-
14.5%
]
14.22%
43626.7%
[
14.5%
-
15.0%
]
14.81%
543.6%
[
15.0%
-
15.5%
]
15.11%
2787.2%
[
15.5%
-
16.0%
]
15.85%
16422.7%
[
16.0%
-
16.5%
]
16.42%
6746.2%
[
17.0%
-
17.5%
]
17.14%
48,1812.4%
[
18.0%
-
18.5%
]
18.23%
1,73311.8%
[
19.0%
-
19.5%
]
19.42%
1,7923.9%
[
21.0%
-
21.5%
]
21.35%
28,2870.062%
[
21.5%
-
22.0%
]
21.57%
2,03545.2%
[
22.5%
-
23.0%
]
22.53%
7,3853.2%
[
23.0%
-
23.5%
]
23.21%
22421.2%
[
24.0%
-
24.5%
]
24.00%
1257.3%
[
24.5%
-
25.0%
]
24.63%
64,3134.3%
[
25.0%
-
25.5%
]
25.23%
95949.3%
[
26.0%
-
26.5%
]
26.04%
8642.3%
[
28.0%
-
28.5%
]
28.39%
23611.5%
[
29.5%
-
30.0%
]
29.82%
95914.1%
[
30.0%
-
30.5%
]
30.23%
25819.8%
[
31.5%
-
32.0%
]
31.96%
3,8584.4%
[
33.0%
-
33.5%
]
33.30%
87122.0%
[
33.5%
-
34.0%
]
33.83%
13358.1%
[
35.5%
-
36.0%
]
35.53%
7627.5%
[
40.5%
-
41.0%
]
40.81%
34,3680.21%
[
41.0%
-
41.5%
]
41.12%
1,4817.9%
[
56.5%
-
57.0%
]
56.67%
605.9%