Hungarian Wage/Income Gap

COMPARE

Hungarian
Race
Ancestry
AfghanAfricanAlaska NativeAlaskan AthabascanAlbanianAleutAlsatianAmericanApacheArabArapahoArgentineanArmenianAssyrian/Chaldean/SyriacAustralianAustrianBahamianBangladeshiBarbadianBasqueBelgianBelizeanBermudanBhutaneseBlackfeetBolivianBrazilianBritishBritish West IndianBulgarianBurmeseCajunCambodianCanadianCape VerdeanCarpatho RusynCelticCentral AmericanCentral American IndianCherokeeCheyenneChickasawChileanChineseChippewaChoctawColombianColvilleComancheCosta RicanCreeCreekCroatianCrowCubanCypriotCzechCzechoslovakianDanishDelawareDominicanDutchDutch West IndianEastern EuropeanEcuadorianEgyptianEnglishEstonianEthiopianEuropeanFijianFilipinoFinnishFrenchFrench American IndianFrench CanadianGermanGerman RussianGhanaianGreekGuamanian/ChamorroGuatemalanGuyaneseHaitianHmongHonduranHopiHoumaHungarianIcelanderIndian (Asian)IndonesianInupiatIranianIraqiIrishIroquoisIsraeliItalianJamaicanJapaneseJordanianKenyanKiowaKoreanLaotianLatvianLebaneseLiberianLithuanianLumbeeLuxembourgerMacedonianMalaysianMalteseMarshalleseMenomineeMexicanMexican American IndianMongolianMoroccanNative HawaiianNavajoNepaleseNew ZealanderNicaraguanNigerianNorthern EuropeanNorwegianOkinawanOsageOttawaPaiutePakistaniPalestinianPanamanianParaguayanPennsylvania GermanPeruvianPimaPolishPortuguesePotawatomiPuebloPuerto RicanPuget Sound SalishRomanianRussianSalvadoranSamoanScandinavianScotch-IrishScottishSeminoleSenegaleseSerbianShoshoneSierra LeoneanSiouxSlavicSlovakSloveneSomaliSouth AfricanSouth AmericanSouth American IndianSoviet UnionSpaniardSpanishSpanish AmericanSpanish American IndianSri LankanSubsaharan AfricanSudaneseSwedishSwissSyrianTaiwaneseThaiTlingit-HaidaTohono O'OdhamTonganTrinidadian and TobagonianTsimshianTurkishU.S. Virgin IslanderUgandanUkrainianUruguayanUteVenezuelanVietnameseWelshWest IndianYakamaYaquiYugoslavianYumanYup'ikZimbabwean
Immigration
NonimmigrantsImmigrantsAfghanistanAfricaAlbaniaArgentinaArmeniaAsiaAustraliaAustriaBahamasBangladeshBarbadosBelarusBelgiumBelizeBoliviaBosnia and HerzegovinaBrazilBulgariaBurma/MyanmarCabo VerdeCambodiaCameroonCanadaCaribbeanCentral AmericaChileChinaColombiaCongoCosta RicaCroatiaCubaCzechoslovakiaDenmarkDominicaDominican RepublicEastern AfricaEastern AsiaEastern EuropeEcuadorEgyptEl SalvadorEnglandEritreaEthiopiaEuropeFijiFranceGermanyGhanaGreeceGrenadaGuatemalaGuyanaHaitiHondurasHong KongHungaryIndiaIndonesiaIranIraqIrelandIsraelItalyJamaicaJapanJordanKazakhstanKenyaKoreaKuwaitLaosLatin AmericaLatviaLebanonLiberiaLithuaniaMalaysiaMexicoMicronesiaMiddle AfricaMoldovaMoroccoNepalNetherlandsNicaraguaNigeriaNorth AmericaNorth MacedoniaNorthern AfricaNorthern EuropeNorwayOceaniaPakistanPanamaPeruPhilippinesPolandPortugalRomaniaRussiaSaudi ArabiaScotlandSenegalSerbiaSierra LeoneSingaporeSomaliaSouth AfricaSouth AmericaSouth Central AsiaSouth Eastern AsiaSouthern EuropeSpainSri LankaSt. Vincent and the GrenadinesSudanSwedenSwitzerlandSyriaTaiwanThailandTrinidad and TobagoTurkeyUgandaUkraineUruguayUzbekistanVenezuelaVietnamWest IndiesWestern AfricaWestern AsiaWestern EuropeYemenZaireZimbabweAzores
Select to Compare
Race
Ancestry
AfghanAfricanAlaska NativeAlaskan AthabascanAlbanianAleutAlsatianAmericanApacheArabArapahoArgentineanArmenianAssyrian/Chaldean/SyriacAustralianAustrianBahamianBangladeshiBarbadianBasqueBelgianBelizeanBermudanBhutaneseBlackfeetBolivianBrazilianBritishBritish West IndianBulgarianBurmeseCajunCambodianCanadianCape VerdeanCarpatho RusynCelticCentral AmericanCentral American IndianCherokeeCheyenneChickasawChileanChineseChippewaChoctawColombianColvilleComancheCosta RicanCreeCreekCroatianCrowCubanCypriotCzechCzechoslovakianDanishDelawareDominicanDutchDutch West IndianEastern EuropeanEcuadorianEgyptianEnglishEstonianEthiopianEuropeanFijianFilipinoFinnishFrenchFrench American IndianFrench CanadianGermanGerman RussianGhanaianGreekGuamanian/ChamorroGuatemalanGuyaneseHaitianHmongHonduranHopiHoumaIcelanderIndian (Asian)IndonesianInupiatIranianIraqiIrishIroquoisIsraeliItalianJamaicanJapaneseJordanianKenyanKiowaKoreanLaotianLatvianLebaneseLiberianLithuanianLumbeeLuxembourgerMacedonianMalaysianMalteseMarshalleseMenomineeMexicanMexican American IndianMongolianMoroccanNative HawaiianNavajoNepaleseNew ZealanderNicaraguanNigerianNorthern EuropeanNorwegianOkinawanOsageOttawaPaiutePakistaniPalestinianPanamanianParaguayanPennsylvania GermanPeruvianPimaPolishPortuguesePotawatomiPuebloPuerto RicanPuget Sound SalishRomanianRussianSalvadoranSamoanScandinavianScotch-IrishScottishSeminoleSenegaleseSerbianShoshoneSierra LeoneanSiouxSlavicSlovakSloveneSomaliSouth AfricanSouth AmericanSouth American IndianSoviet UnionSpaniardSpanishSpanish AmericanSpanish American IndianSri LankanSubsaharan AfricanSudaneseSwedishSwissSyrianTaiwaneseThaiTlingit-HaidaTohono O'OdhamTonganTrinidadian and TobagonianTsimshianTurkishU.S. Virgin IslanderUgandanUkrainianUruguayanUteVenezuelanVietnameseWelshWest IndianYakamaYaquiYugoslavianYumanYup'ikZimbabwean
Immigration
NonimmigrantsImmigrantsAfghanistanAfricaAlbaniaArgentinaArmeniaAsiaAustraliaAustriaBahamasBangladeshBarbadosBelarusBelgiumBelizeBoliviaBosnia and HerzegovinaBrazilBulgariaBurma/MyanmarCabo VerdeCambodiaCameroonCanadaCaribbeanCentral AmericaChileChinaColombiaCongoCosta RicaCroatiaCubaCzechoslovakiaDenmarkDominicaDominican RepublicEastern AfricaEastern AsiaEastern EuropeEcuadorEgyptEl SalvadorEnglandEritreaEthiopiaEuropeFijiFranceGermanyGhanaGreeceGrenadaGuatemalaGuyanaHaitiHondurasHong KongHungaryIndiaIndonesiaIranIraqIrelandIsraelItalyJamaicaJapanJordanKazakhstanKenyaKoreaKuwaitLaosLatin AmericaLatviaLebanonLiberiaLithuaniaMalaysiaMexicoMicronesiaMiddle AfricaMoldovaMoroccoNepalNetherlandsNicaraguaNigeriaNorth AmericaNorth MacedoniaNorthern AfricaNorthern EuropeNorwayOceaniaPakistanPanamaPeruPhilippinesPolandPortugalRomaniaRussiaSaudi ArabiaScotlandSenegalSerbiaSierra LeoneSingaporeSomaliaSouth AfricaSouth AmericaSouth Central AsiaSouth Eastern AsiaSouthern EuropeSpainSri LankaSt. Vincent and the GrenadinesSudanSwedenSwitzerlandSyriaTaiwanThailandTrinidad and TobagoTurkeyUgandaUkraineUruguayUzbekistanVenezuelaVietnamWest IndiesWestern AfricaWestern AsiaWestern EuropeYemenZaireZimbabweAzores
Wage/Income Gap
Income
Poverty
Unemployment
Labor Participation
Family Structure
Vehicle Availability
Education Level
Disability

Hungarian Wage/Income Gap
Tragic

29.0%
WAGE/INCOME GAP
0.0/ 100
METRIC RATING
325th/ 347
METRIC RANK

Hungarian Wage/Income Gap Correlation Chart

The statistical analysis conducted on geographies consisting of 485,427,318 people shows a significant positive correlation between the proportion of Hungarians and wage/income gap percentage in the United States with a correlation coefficient (R) of 0.602 and weighted average of 29.0%. On average, for every 1% (one percent) increase in Hungarians within a typical geography, there is an increase of 0.71% in wage/income gap percentage.
Hungarian Wage/Income Gap
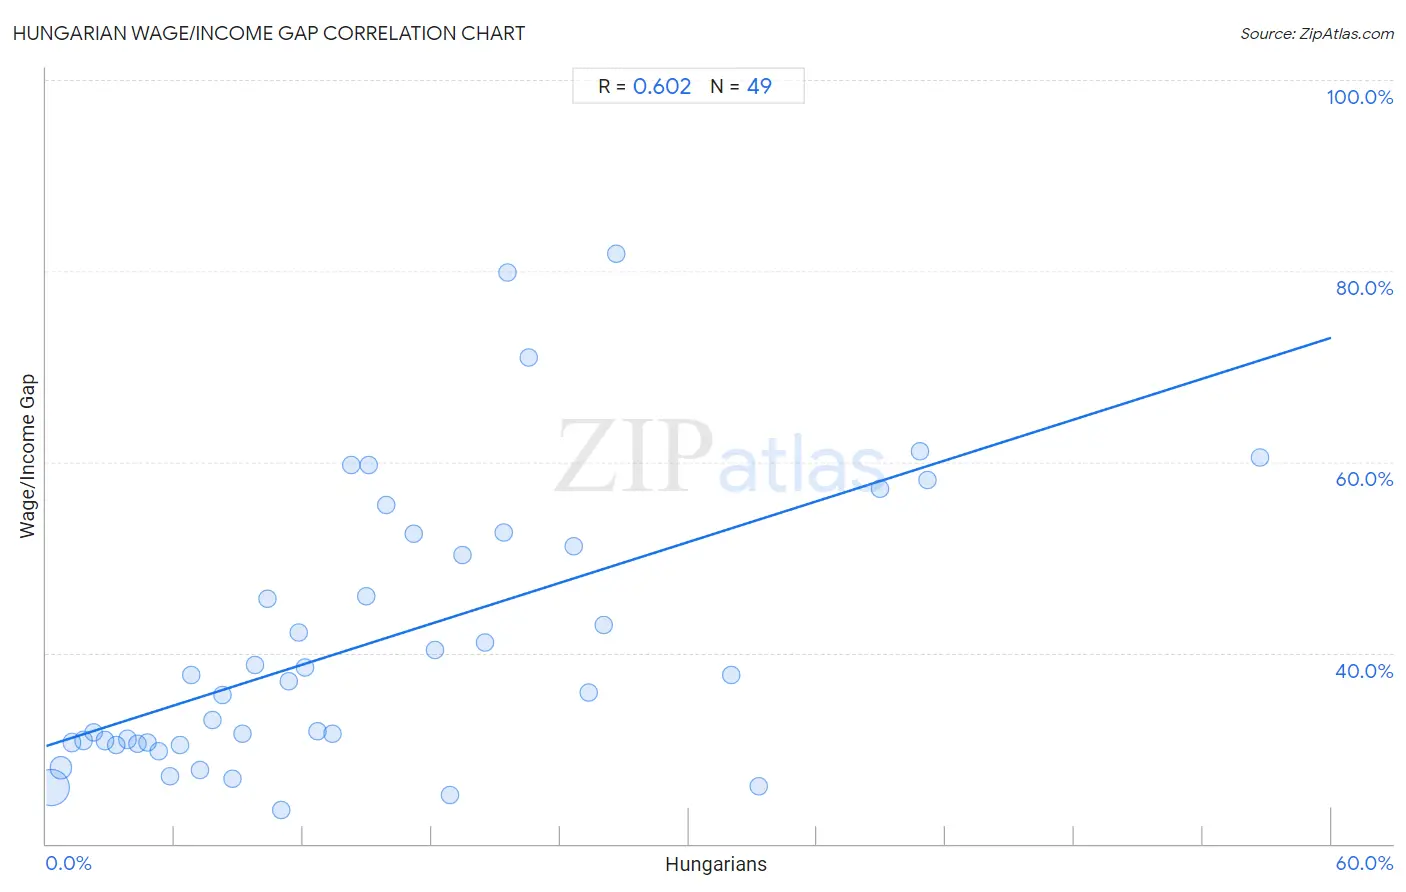
It is essential to understand that the correlation between the percentage of Hungarians and wage/income gap percentage does not imply a direct cause-and-effect relationship. It remains uncertain whether the presence of Hungarians influences an upward or downward trend in the level of wage/income gap percentage within an area, or if Hungarians simply ended up residing in those areas with higher or lower levels of wage/income gap percentage due to other factors.

Demographics Similar to Hungarians by Wage/Income Gap

In terms of wage/income gap, the demographic groups most similar to Hungarians are Immigrants from Belgium (29.0%, a difference of 0.070%), Croatian (29.0%, a difference of 0.13%), Immigrants from Iran (29.1%, a difference of 0.18%), Scandinavian (29.1%, a difference of 0.24%), and Norwegian (29.0%, a difference of 0.25%).
DemographicsRating | RankWage/Income Gap
Basques
0.1
/100
|
#318
Tragic
28.8%
Slovaks
0.1
/100
|
#319
Tragic
28.9%
British
0.1
/100
|
#320
Tragic
28.9%
Welsh
0.1
/100
|
#321
Tragic
28.9%
Immigrants from Singapore
0.1
/100
|
#322
Tragic
28.9%
Norwegians
0.1
/100
|
#323
Tragic
29.0%
Croatians
0.0
/100
|
#324
Tragic
29.0%
Hungarians
0.0
/100
|
#325
Tragic
29.0%
Immigrants from Belgium
0.0
/100
|
#326
Tragic
29.0%
Immigrants from Iran
0.0
/100
|
#327
Tragic
29.1%
Scandinavians
0.0
/100
|
#328
Tragic
29.1%
Scottish
0.0
/100
|
#329
Tragic
29.1%
Germans
0.0
/100
|
#330
Tragic
29.2%
Czechs
0.0
/100
|
#331
Tragic
29.2%
Immigrants from South Central Asia
0.0
/100
|
#332
Tragic
29.3%

Hungarian Wage/Income Gap Correlation Summary

MeasurementHungarian DataWage/Income Gap Data
Minimum0.21%23.5%
Maximum56.7%81.8%
Range56.5%58.3%
Mean15.2%41.1%
Median12.1%37.0%
Interquartile 25% (IQ1)6.0%30.6%
Interquartile 75% (IQ3)21.4%51.8%
Interquartile Range (IQR)15.4%21.2%
Standard Deviation (Sample)12.3%14.5%
Standard Deviation (Population)12.1%14.3%

Correlation Details

Hungarian PercentileSample SizeWage/Income Gap
[
0.0%
-
0.5%
]
0.21%
357,085,86026.0%
[
0.5%
-
1.0%
]
0.68%
85,670,02028.0%
[
1.0%
-
1.5%
]
1.20%
21,764,65630.6%
[
1.5%
-
2.0%
]
1.73%
8,643,87730.8%
[
2.0%
-
2.5%
]
2.23%
4,060,44031.6%
[
2.5%
-
3.0%
]
2.75%
2,252,77630.8%
[
3.0%
-
3.5%
]
3.25%
1,819,10430.4%
[
3.5%
-
4.0%
]
3.77%
1,286,34630.9%
[
4.0%
-
4.5%
]
4.26%
899,27030.5%
[
4.5%
-
5.0%
]
4.74%
453,78730.6%
[
5.0%
-
5.5%
]
5.28%
435,50029.6%
[
5.5%
-
6.0%
]
5.79%
149,34527.1%
[
6.0%
-
6.5%
]
6.22%
142,47030.3%
[
6.5%
-
7.0%
]
6.77%
114,53137.7%
[
7.0%
-
7.5%
]
7.18%
78,54327.7%
[
7.5%
-
8.0%
]
7.75%
70,05332.9%
[
8.0%
-
8.5%
]
8.21%
47,00235.6%
[
8.5%
-
9.0%
]
8.70%
26,45826.8%
[
9.0%
-
9.5%
]
9.17%
13,69031.6%
[
9.5%
-
10.0%
]
9.73%
11,69038.7%
[
10.0%
-
10.5%
]
10.34%
4,76945.6%
[
10.5%
-
11.0%
]
10.95%
53,62723.5%
[
11.0%
-
11.5%
]
11.30%
26,06837.0%
[
11.5%
-
12.0%
]
11.77%
18,19842.2%
[
12.0%
-
12.5%
]
12.06%
76,57438.4%
[
12.5%
-
13.0%
]
12.67%
2,42331.7%
[
13.0%
-
13.5%
]
13.35%
2,21831.5%
[
14.0%
-
14.5%
]
14.25%
36559.6%
[
14.5%
-
15.0%
]
14.94%
30846.0%
[
15.0%
-
15.5%
]
15.05%
6,87959.7%
[
15.5%
-
16.0%
]
15.85%
16455.5%
[
17.0%
-
17.5%
]
17.14%
48,22952.4%
[
18.0%
-
18.5%
]
18.13%
1,30240.3%
[
18.5%
-
19.0%
]
18.84%
80725.1%
[
19.0%
-
19.5%
]
19.42%
1,79250.3%
[
20.0%
-
20.5%
]
20.49%
61041.1%
[
21.0%
-
21.5%
]
21.35%
28,28752.6%
[
21.5%
-
22.0%
]
21.54%
93379.8%
[
22.5%
-
23.0%
]
22.53%
7,38570.9%
[
24.5%
-
25.0%
]
24.63%
64,19351.1%
[
25.0%
-
25.5%
]
25.30%
5,50135.8%
[
26.0%
-
26.5%
]
26.04%
86442.9%
[
26.5%
-
27.0%
]
26.60%
18881.8%
[
31.5%
-
32.0%
]
31.96%
3,85837.6%
[
33.0%
-
33.5%
]
33.30%
87126.0%
[
38.5%
-
39.0%
]
38.95%
9,57857.2%
[
40.5%
-
41.0%
]
40.81%
34,36861.2%
[
41.0%
-
41.5%
]
41.12%
1,48158.1%
[
56.5%
-
57.0%
]
56.67%
6060.5%