Hmong 3 or more Vehicles in Household

COMPARE

Hmong
Race
Ancestry
AfghanAfricanAlaska NativeAlaskan AthabascanAlbanianAleutAlsatianAmericanApacheArabArapahoArgentineanArmenianAssyrian/Chaldean/SyriacAustralianAustrianBahamianBangladeshiBarbadianBasqueBelgianBelizeanBermudanBhutaneseBlackfeetBolivianBrazilianBritishBritish West IndianBulgarianBurmeseCajunCambodianCanadianCape VerdeanCarpatho RusynCelticCentral AmericanCentral American IndianCherokeeCheyenneChickasawChileanChineseChippewaChoctawColombianColvilleComancheCosta RicanCreeCreekCroatianCrowCubanCypriotCzechCzechoslovakianDanishDelawareDominicanDutchDutch West IndianEastern EuropeanEcuadorianEgyptianEnglishEstonianEthiopianEuropeanFijianFilipinoFinnishFrenchFrench American IndianFrench CanadianGermanGerman RussianGhanaianGreekGuamanian/ChamorroGuatemalanGuyaneseHaitianHmongHonduranHopiHoumaHungarianIcelanderIndian (Asian)IndonesianInupiatIranianIraqiIrishIroquoisIsraeliItalianJamaicanJapaneseJordanianKenyanKiowaKoreanLaotianLatvianLebaneseLiberianLithuanianLumbeeLuxembourgerMacedonianMalaysianMalteseMarshalleseMenomineeMexicanMexican American IndianMongolianMoroccanNative HawaiianNavajoNepaleseNew ZealanderNicaraguanNigerianNorthern EuropeanNorwegianOkinawanOsageOttawaPaiutePakistaniPalestinianPanamanianParaguayanPennsylvania GermanPeruvianPimaPolishPortuguesePotawatomiPuebloPuerto RicanPuget Sound SalishRomanianRussianSalvadoranSamoanScandinavianScotch-IrishScottishSeminoleSenegaleseSerbianShoshoneSierra LeoneanSiouxSlavicSlovakSloveneSomaliSouth AfricanSouth AmericanSouth American IndianSoviet UnionSpaniardSpanishSpanish AmericanSpanish American IndianSri LankanSubsaharan AfricanSudaneseSwedishSwissSyrianTaiwaneseThaiTlingit-HaidaTohono O'OdhamTonganTrinidadian and TobagonianTsimshianTurkishU.S. Virgin IslanderUgandanUkrainianUruguayanUteVenezuelanVietnameseWelshWest IndianYakamaYaquiYugoslavianYumanYup'ikZimbabwean
Immigration
NonimmigrantsImmigrantsAfghanistanAfricaAlbaniaArgentinaArmeniaAsiaAustraliaAustriaBahamasBangladeshBarbadosBelarusBelgiumBelizeBoliviaBosnia and HerzegovinaBrazilBulgariaBurma/MyanmarCabo VerdeCambodiaCameroonCanadaCaribbeanCentral AmericaChileChinaColombiaCongoCosta RicaCroatiaCubaCzechoslovakiaDenmarkDominicaDominican RepublicEastern AfricaEastern AsiaEastern EuropeEcuadorEgyptEl SalvadorEnglandEritreaEthiopiaEuropeFijiFranceGermanyGhanaGreeceGrenadaGuatemalaGuyanaHaitiHondurasHong KongHungaryIndiaIndonesiaIranIraqIrelandIsraelItalyJamaicaJapanJordanKazakhstanKenyaKoreaKuwaitLaosLatin AmericaLatviaLebanonLiberiaLithuaniaMalaysiaMexicoMicronesiaMiddle AfricaMoldovaMoroccoNepalNetherlandsNicaraguaNigeriaNorth AmericaNorth MacedoniaNorthern AfricaNorthern EuropeNorwayOceaniaPakistanPanamaPeruPhilippinesPolandPortugalRomaniaRussiaSaudi ArabiaScotlandSenegalSerbiaSierra LeoneSingaporeSomaliaSouth AfricaSouth AmericaSouth Central AsiaSouth Eastern AsiaSouthern EuropeSpainSri LankaSt. Vincent and the GrenadinesSudanSwedenSwitzerlandSyriaTaiwanThailandTrinidad and TobagoTurkeyUgandaUkraineUruguayUzbekistanVenezuelaVietnamWest IndiesWestern AfricaWestern AsiaWestern EuropeYemenZaireZimbabweAzores
Select to Compare
Race
Ancestry
AfghanAfricanAlaska NativeAlaskan AthabascanAlbanianAleutAlsatianAmericanApacheArabArapahoArgentineanArmenianAssyrian/Chaldean/SyriacAustralianAustrianBahamianBangladeshiBarbadianBasqueBelgianBelizeanBermudanBhutaneseBlackfeetBolivianBrazilianBritishBritish West IndianBulgarianBurmeseCajunCambodianCanadianCape VerdeanCarpatho RusynCelticCentral AmericanCentral American IndianCherokeeCheyenneChickasawChileanChineseChippewaChoctawColombianColvilleComancheCosta RicanCreeCreekCroatianCrowCubanCypriotCzechCzechoslovakianDanishDelawareDominicanDutchDutch West IndianEastern EuropeanEcuadorianEgyptianEnglishEstonianEthiopianEuropeanFijianFilipinoFinnishFrenchFrench American IndianFrench CanadianGermanGerman RussianGhanaianGreekGuamanian/ChamorroGuatemalanGuyaneseHaitianHonduranHopiHoumaHungarianIcelanderIndian (Asian)IndonesianInupiatIranianIraqiIrishIroquoisIsraeliItalianJamaicanJapaneseJordanianKenyanKiowaKoreanLaotianLatvianLebaneseLiberianLithuanianLumbeeLuxembourgerMacedonianMalaysianMalteseMarshalleseMenomineeMexicanMexican American IndianMongolianMoroccanNative HawaiianNavajoNepaleseNew ZealanderNicaraguanNigerianNorthern EuropeanNorwegianOkinawanOsageOttawaPaiutePakistaniPalestinianPanamanianParaguayanPennsylvania GermanPeruvianPimaPolishPortuguesePotawatomiPuebloPuerto RicanPuget Sound SalishRomanianRussianSalvadoranSamoanScandinavianScotch-IrishScottishSeminoleSenegaleseSerbianShoshoneSierra LeoneanSiouxSlavicSlovakSloveneSomaliSouth AfricanSouth AmericanSouth American IndianSoviet UnionSpaniardSpanishSpanish AmericanSpanish American IndianSri LankanSubsaharan AfricanSudaneseSwedishSwissSyrianTaiwaneseThaiTlingit-HaidaTohono O'OdhamTonganTrinidadian and TobagonianTsimshianTurkishU.S. Virgin IslanderUgandanUkrainianUruguayanUteVenezuelanVietnameseWelshWest IndianYakamaYaquiYugoslavianYumanYup'ikZimbabwean
Immigration
NonimmigrantsImmigrantsAfghanistanAfricaAlbaniaArgentinaArmeniaAsiaAustraliaAustriaBahamasBangladeshBarbadosBelarusBelgiumBelizeBoliviaBosnia and HerzegovinaBrazilBulgariaBurma/MyanmarCabo VerdeCambodiaCameroonCanadaCaribbeanCentral AmericaChileChinaColombiaCongoCosta RicaCroatiaCubaCzechoslovakiaDenmarkDominicaDominican RepublicEastern AfricaEastern AsiaEastern EuropeEcuadorEgyptEl SalvadorEnglandEritreaEthiopiaEuropeFijiFranceGermanyGhanaGreeceGrenadaGuatemalaGuyanaHaitiHondurasHong KongHungaryIndiaIndonesiaIranIraqIrelandIsraelItalyJamaicaJapanJordanKazakhstanKenyaKoreaKuwaitLaosLatin AmericaLatviaLebanonLiberiaLithuaniaMalaysiaMexicoMicronesiaMiddle AfricaMoldovaMoroccoNepalNetherlandsNicaraguaNigeriaNorth AmericaNorth MacedoniaNorthern AfricaNorthern EuropeNorwayOceaniaPakistanPanamaPeruPhilippinesPolandPortugalRomaniaRussiaSaudi ArabiaScotlandSenegalSerbiaSierra LeoneSingaporeSomaliaSouth AfricaSouth AmericaSouth Central AsiaSouth Eastern AsiaSouthern EuropeSpainSri LankaSt. Vincent and the GrenadinesSudanSwedenSwitzerlandSyriaTaiwanThailandTrinidad and TobagoTurkeyUgandaUkraineUruguayUzbekistanVenezuelaVietnamWest IndiesWestern AfricaWestern AsiaWestern EuropeYemenZaireZimbabweAzores
3 or more Vehicles in Household
Income
Poverty
Unemployment
Labor Participation
Family Structure
Vehicle Availability
Education Level
Disability

Hmong 3 or more Vehicles in Household
Exceptional

21.0%
3+ VEHICLES AVAILABLE
98.2/ 100
METRIC RATING
98th/ 347
METRIC RANK

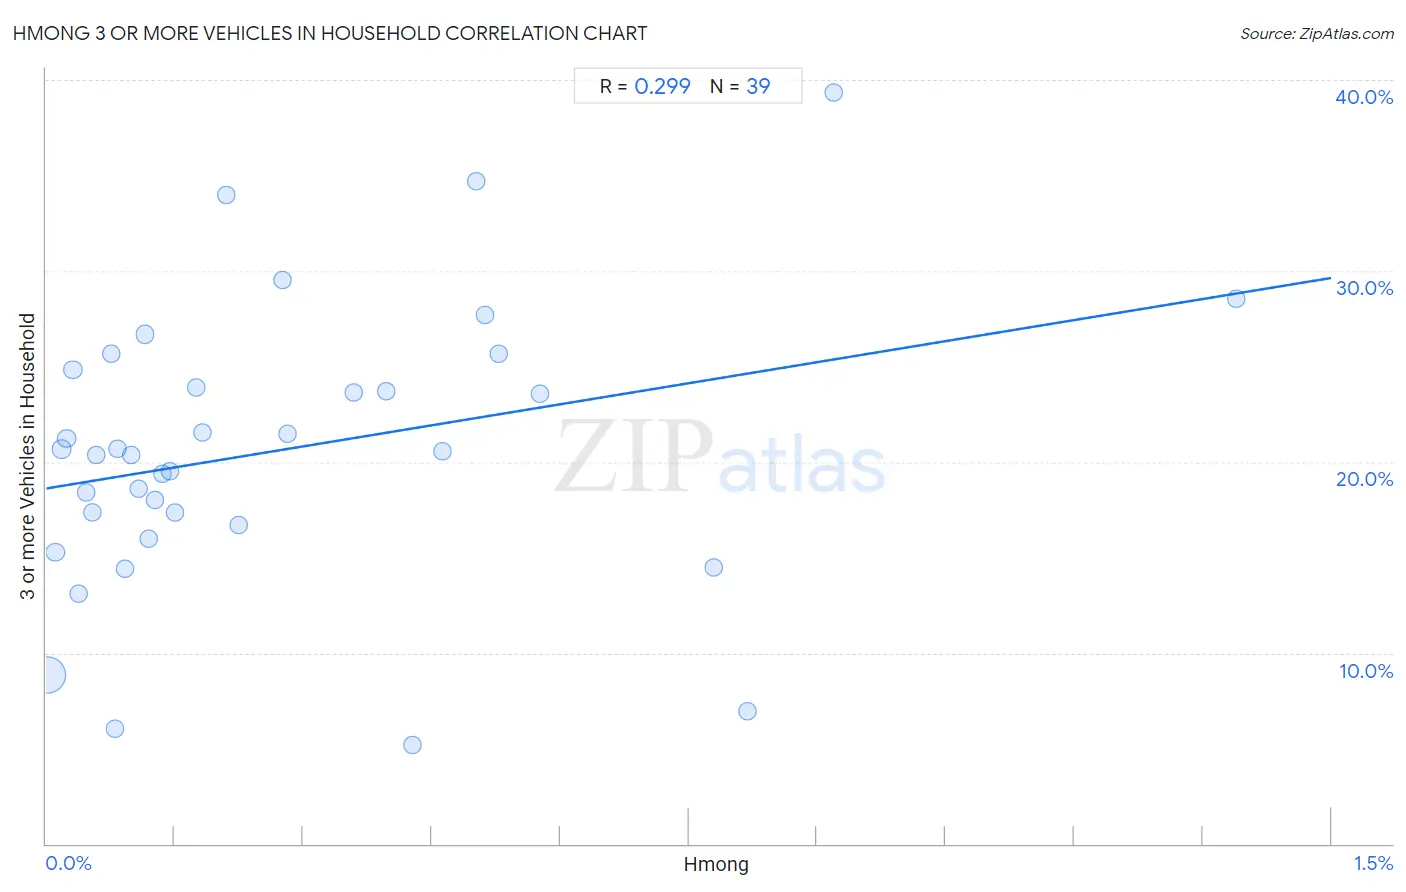
Hmong 3 or more Vehicles in Household Correlation Chart

The statistical analysis conducted on geographies consisting of 24,678,157 people shows a weak positive correlation between the proportion of Hmong and percentage of households with 3 or more vehicles available in the United States with a correlation coefficient (R) of 0.299 and weighted average of 21.0%. On average, for every 1% (one percent) increase in Hmong within a typical geography, there is an increase of 7.3% in percentage of households with 3 or more vehicles available.
Hmong 3 or more Vehicles in Household
It is essential to understand that the correlation between the percentage of Hmong and percentage of households with 3 or more vehicles available does not imply a direct cause-and-effect relationship. It remains uncertain whether the presence of Hmong influences an upward or downward trend in the level of percentage of households with 3 or more vehicles available within an area, or if Hmong simply ended up residing in those areas with higher or lower levels of percentage of households with 3 or more vehicles available due to other factors.

Demographics Similar to Hmong by 3 or more Vehicles in Household

In terms of 3 or more vehicles in household, the demographic groups most similar to Hmong are Alaska Native (21.0%, a difference of 0.0%), Comanche (21.0%, a difference of 0.040%), Canadian (21.0%, a difference of 0.060%), Cree (21.0%, a difference of 0.16%), and Pakistani (21.0%, a difference of 0.26%).
DemographicsRating | Rank3 or more Vehicles in Household
Belgians
98.9
/100
|
#91
Exceptional
21.2%
Apache
98.9
/100
|
#92
Exceptional
21.2%
Immigrants from Indonesia
98.8
/100
|
#93
Exceptional
21.1%
Immigrants from Cambodia
98.6
/100
|
#94
Exceptional
21.1%
Pakistanis
98.5
/100
|
#95
Exceptional
21.0%
Cree
98.4
/100
|
#96
Exceptional
21.0%
Canadians
98.3
/100
|
#97
Exceptional
21.0%
Hmong
98.2
/100
|
#98
Exceptional
21.0%
Alaska Natives
98.2
/100
|
#99
Exceptional
21.0%
Comanche
98.2
/100
|
#100
Exceptional
21.0%
Blackfeet
97.9
/100
|
#101
Exceptional
20.9%
Seminole
97.8
/100
|
#102
Exceptional
20.9%
Dutch West Indians
97.8
/100
|
#103
Exceptional
20.9%
Luxembourgers
97.7
/100
|
#104
Exceptional
20.9%
Austrians
97.5
/100
|
#105
Exceptional
20.9%

Hmong 3 or more Vehicles in Household Correlation Summary

MeasurementHmong Data3 or more Vehicles in Household Data
Minimum0.0014%5.2%
Maximum1.4%39.3%
Range1.4%34.1%
Mean0.27%20.6%
Median0.14%20.6%
Interquartile 25% (IQ1)0.076%16.7%
Interquartile 75% (IQ3)0.43%24.8%
Interquartile Range (IQR)0.35%8.1%
Standard Deviation (Sample)0.30%7.4%
Standard Deviation (Population)0.30%7.3%

Correlation Details

Hmong PercentileSample Size3 or more Vehicles in Household
[
0.0%
-
0.5%
]
0.0014%
20,776,2978.8%
[
0.0%
-
0.5%
]
0.011%
606,58715.3%
[
0.0%
-
0.5%
]
0.018%
619,81920.7%
[
0.0%
-
0.5%
]
0.024%
529,13521.2%
[
0.0%
-
0.5%
]
0.031%
540,13124.8%
[
0.0%
-
0.5%
]
0.038%
194,44513.1%
[
0.0%
-
0.5%
]
0.047%
199,12618.4%
[
0.0%
-
0.5%
]
0.053%
232,79317.4%
[
0.0%
-
0.5%
]
0.058%
35,97620.4%
[
0.0%
-
0.5%
]
0.076%
17,11725.7%
[
0.0%
-
0.5%
]
0.080%
73,7356.0%
[
0.0%
-
0.5%
]
0.084%
41,84920.7%
[
0.0%
-
0.5%
]
0.092%
60,98614.4%
[
0.0%
-
0.5%
]
0.099%
51,76520.4%
[
0.0%
-
0.5%
]
0.11%
103,08018.6%
[
0.0%
-
0.5%
]
0.11%
49,74726.7%
[
0.0%
-
0.5%
]
0.12%
72,43516.0%
[
0.0%
-
0.5%
]
0.13%
13,42518.0%
[
0.0%
-
0.5%
]
0.14%
38,96419.4%
[
0.0%
-
0.5%
]
0.14%
25,62519.5%
[
0.0%
-
0.5%
]
0.15%
39,18217.4%
[
0.0%
-
0.5%
]
0.17%
25,17623.9%
[
0.0%
-
0.5%
]
0.18%
51,92621.6%
[
0.0%
-
0.5%
]
0.21%
12,89234.0%
[
0.0%
-
0.5%
]
0.22%
50,29816.7%
[
0.0%
-
0.5%
]
0.28%
2,53429.5%
[
0.0%
-
0.5%
]
0.28%
15,62821.5%
[
0.0%
-
0.5%
]
0.36%
44,07323.6%
[
0.0%
-
0.5%
]
0.40%
50323.7%
[
0.0%
-
0.5%
]
0.43%
8,4185.2%
[
0.0%
-
0.5%
]
0.46%
4,96520.6%
[
0.5%
-
1.0%
]
0.50%
79634.7%
[
0.5%
-
1.0%
]
0.51%
64,95227.7%
[
0.5%
-
1.0%
]
0.53%
7,56725.7%
[
0.5%
-
1.0%
]
0.58%
9,20323.5%
[
0.5%
-
1.0%
]
0.78%
11,54414.4%
[
0.5%
-
1.0%
]
0.82%
10,9976.9%
[
0.5%
-
1.0%
]
0.92%
34,17839.3%
[
1.0%
-
1.5%
]
1.39%
28828.6%