Hmong Self-Care Disability

COMPARE

Hmong
Race
Ancestry
AfghanAfricanAlaska NativeAlaskan AthabascanAlbanianAleutAlsatianAmericanApacheArabArapahoArgentineanArmenianAssyrian/Chaldean/SyriacAustralianAustrianBahamianBangladeshiBarbadianBasqueBelgianBelizeanBermudanBhutaneseBlackfeetBolivianBrazilianBritishBritish West IndianBulgarianBurmeseCajunCambodianCanadianCape VerdeanCarpatho RusynCelticCentral AmericanCentral American IndianCherokeeCheyenneChickasawChileanChineseChippewaChoctawColombianColvilleComancheCosta RicanCreeCreekCroatianCrowCubanCypriotCzechCzechoslovakianDanishDelawareDominicanDutchDutch West IndianEastern EuropeanEcuadorianEgyptianEnglishEstonianEthiopianEuropeanFijianFilipinoFinnishFrenchFrench American IndianFrench CanadianGermanGerman RussianGhanaianGreekGuamanian/ChamorroGuatemalanGuyaneseHaitianHmongHonduranHopiHoumaHungarianIcelanderIndian (Asian)IndonesianInupiatIranianIraqiIrishIroquoisIsraeliItalianJamaicanJapaneseJordanianKenyanKiowaKoreanLaotianLatvianLebaneseLiberianLithuanianLumbeeLuxembourgerMacedonianMalaysianMalteseMarshalleseMenomineeMexicanMexican American IndianMongolianMoroccanNative HawaiianNavajoNepaleseNew ZealanderNicaraguanNigerianNorthern EuropeanNorwegianOkinawanOsageOttawaPaiutePakistaniPalestinianPanamanianParaguayanPennsylvania GermanPeruvianPimaPolishPortuguesePotawatomiPuebloPuerto RicanPuget Sound SalishRomanianRussianSalvadoranSamoanScandinavianScotch-IrishScottishSeminoleSenegaleseSerbianShoshoneSierra LeoneanSiouxSlavicSlovakSloveneSomaliSouth AfricanSouth AmericanSouth American IndianSoviet UnionSpaniardSpanishSpanish AmericanSpanish American IndianSri LankanSubsaharan AfricanSudaneseSwedishSwissSyrianTaiwaneseThaiTlingit-HaidaTohono O'OdhamTonganTrinidadian and TobagonianTsimshianTurkishU.S. Virgin IslanderUgandanUkrainianUruguayanUteVenezuelanVietnameseWelshWest IndianYakamaYaquiYugoslavianYumanYup'ikZimbabwean
Immigration
NonimmigrantsImmigrantsAfghanistanAfricaAlbaniaArgentinaArmeniaAsiaAustraliaAustriaBahamasBangladeshBarbadosBelarusBelgiumBelizeBoliviaBosnia and HerzegovinaBrazilBulgariaBurma/MyanmarCabo VerdeCambodiaCameroonCanadaCaribbeanCentral AmericaChileChinaColombiaCongoCosta RicaCroatiaCubaCzechoslovakiaDenmarkDominicaDominican RepublicEastern AfricaEastern AsiaEastern EuropeEcuadorEgyptEl SalvadorEnglandEritreaEthiopiaEuropeFijiFranceGermanyGhanaGreeceGrenadaGuatemalaGuyanaHaitiHondurasHong KongHungaryIndiaIndonesiaIranIraqIrelandIsraelItalyJamaicaJapanJordanKazakhstanKenyaKoreaKuwaitLaosLatin AmericaLatviaLebanonLiberiaLithuaniaMalaysiaMexicoMicronesiaMiddle AfricaMoldovaMoroccoNepalNetherlandsNicaraguaNigeriaNorth AmericaNorth MacedoniaNorthern AfricaNorthern EuropeNorwayOceaniaPakistanPanamaPeruPhilippinesPolandPortugalRomaniaRussiaSaudi ArabiaScotlandSenegalSerbiaSierra LeoneSingaporeSomaliaSouth AfricaSouth AmericaSouth Central AsiaSouth Eastern AsiaSouthern EuropeSpainSri LankaSt. Vincent and the GrenadinesSudanSwedenSwitzerlandSyriaTaiwanThailandTrinidad and TobagoTurkeyUgandaUkraineUruguayUzbekistanVenezuelaVietnamWest IndiesWestern AfricaWestern AsiaWestern EuropeYemenZaireZimbabweAzores
Select to Compare
Race
Ancestry
AfghanAfricanAlaska NativeAlaskan AthabascanAlbanianAleutAlsatianAmericanApacheArabArapahoArgentineanArmenianAssyrian/Chaldean/SyriacAustralianAustrianBahamianBangladeshiBarbadianBasqueBelgianBelizeanBermudanBhutaneseBlackfeetBolivianBrazilianBritishBritish West IndianBulgarianBurmeseCajunCambodianCanadianCape VerdeanCarpatho RusynCelticCentral AmericanCentral American IndianCherokeeCheyenneChickasawChileanChineseChippewaChoctawColombianColvilleComancheCosta RicanCreeCreekCroatianCrowCubanCypriotCzechCzechoslovakianDanishDelawareDominicanDutchDutch West IndianEastern EuropeanEcuadorianEgyptianEnglishEstonianEthiopianEuropeanFijianFilipinoFinnishFrenchFrench American IndianFrench CanadianGermanGerman RussianGhanaianGreekGuamanian/ChamorroGuatemalanGuyaneseHaitianHonduranHopiHoumaHungarianIcelanderIndian (Asian)IndonesianInupiatIranianIraqiIrishIroquoisIsraeliItalianJamaicanJapaneseJordanianKenyanKiowaKoreanLaotianLatvianLebaneseLiberianLithuanianLumbeeLuxembourgerMacedonianMalaysianMalteseMarshalleseMenomineeMexicanMexican American IndianMongolianMoroccanNative HawaiianNavajoNepaleseNew ZealanderNicaraguanNigerianNorthern EuropeanNorwegianOkinawanOsageOttawaPaiutePakistaniPalestinianPanamanianParaguayanPennsylvania GermanPeruvianPimaPolishPortuguesePotawatomiPuebloPuerto RicanPuget Sound SalishRomanianRussianSalvadoranSamoanScandinavianScotch-IrishScottishSeminoleSenegaleseSerbianShoshoneSierra LeoneanSiouxSlavicSlovakSloveneSomaliSouth AfricanSouth AmericanSouth American IndianSoviet UnionSpaniardSpanishSpanish AmericanSpanish American IndianSri LankanSubsaharan AfricanSudaneseSwedishSwissSyrianTaiwaneseThaiTlingit-HaidaTohono O'OdhamTonganTrinidadian and TobagonianTsimshianTurkishU.S. Virgin IslanderUgandanUkrainianUruguayanUteVenezuelanVietnameseWelshWest IndianYakamaYaquiYugoslavianYumanYup'ikZimbabwean
Immigration
NonimmigrantsImmigrantsAfghanistanAfricaAlbaniaArgentinaArmeniaAsiaAustraliaAustriaBahamasBangladeshBarbadosBelarusBelgiumBelizeBoliviaBosnia and HerzegovinaBrazilBulgariaBurma/MyanmarCabo VerdeCambodiaCameroonCanadaCaribbeanCentral AmericaChileChinaColombiaCongoCosta RicaCroatiaCubaCzechoslovakiaDenmarkDominicaDominican RepublicEastern AfricaEastern AsiaEastern EuropeEcuadorEgyptEl SalvadorEnglandEritreaEthiopiaEuropeFijiFranceGermanyGhanaGreeceGrenadaGuatemalaGuyanaHaitiHondurasHong KongHungaryIndiaIndonesiaIranIraqIrelandIsraelItalyJamaicaJapanJordanKazakhstanKenyaKoreaKuwaitLaosLatin AmericaLatviaLebanonLiberiaLithuaniaMalaysiaMexicoMicronesiaMiddle AfricaMoldovaMoroccoNepalNetherlandsNicaraguaNigeriaNorth AmericaNorth MacedoniaNorthern AfricaNorthern EuropeNorwayOceaniaPakistanPanamaPeruPhilippinesPolandPortugalRomaniaRussiaSaudi ArabiaScotlandSenegalSerbiaSierra LeoneSingaporeSomaliaSouth AfricaSouth AmericaSouth Central AsiaSouth Eastern AsiaSouthern EuropeSpainSri LankaSt. Vincent and the GrenadinesSudanSwedenSwitzerlandSyriaTaiwanThailandTrinidad and TobagoTurkeyUgandaUkraineUruguayUzbekistanVenezuelaVietnamWest IndiesWestern AfricaWestern AsiaWestern EuropeYemenZaireZimbabweAzores
Self-Care Disability
Income
Poverty
Unemployment
Labor Participation
Family Structure
Vehicle Availability
Education Level
Disability

Hmong Self-Care Disability
Excellent

2.4%
SELF-CARE DISABILITY
89.9/ 100
METRIC RATING
126th/ 347
METRIC RANK

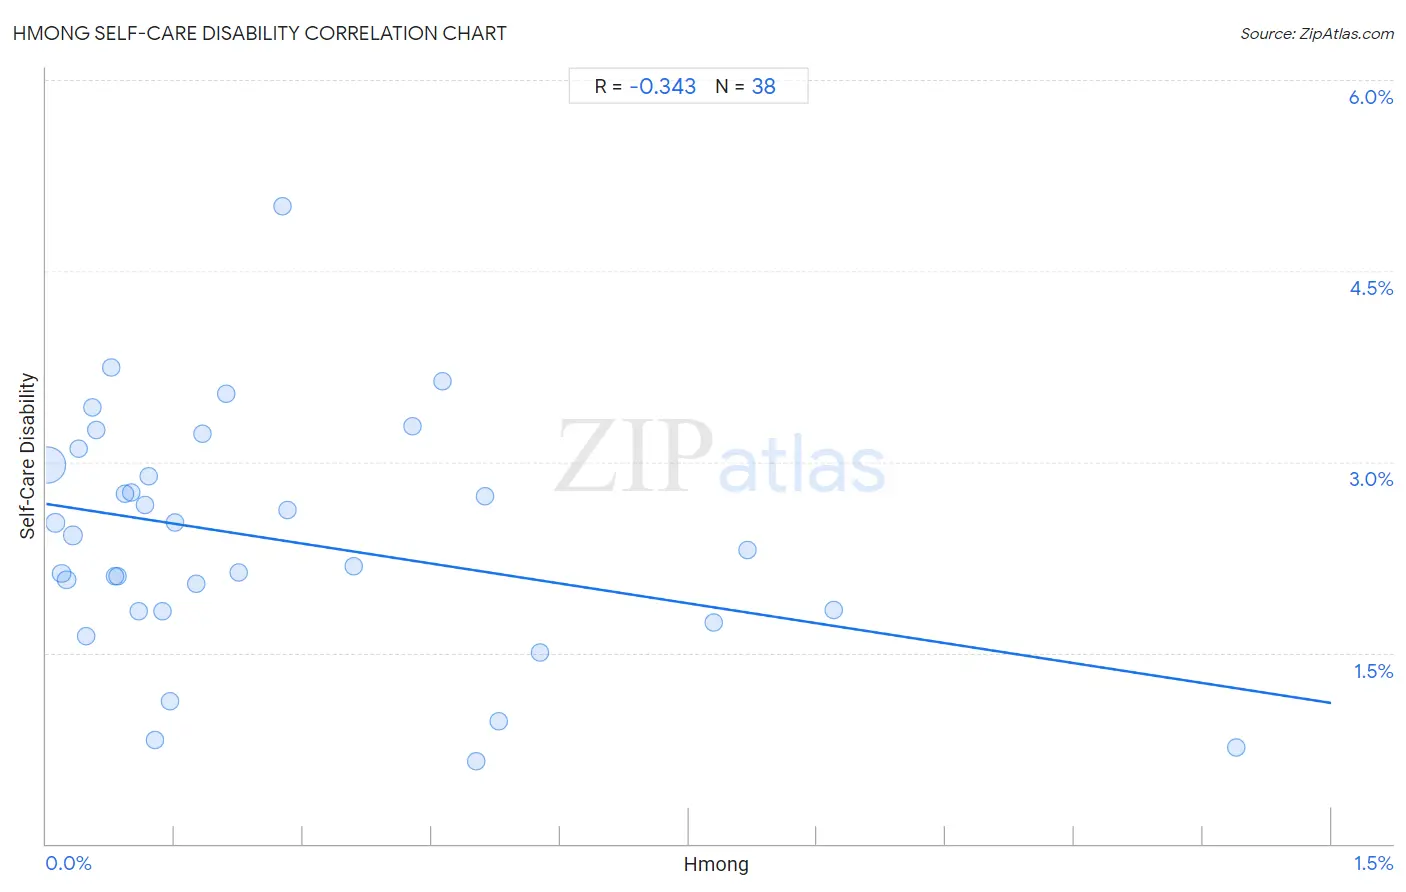
Hmong Self-Care Disability Correlation Chart

The statistical analysis conducted on geographies consisting of 24,680,008 people shows a mild negative correlation between the proportion of Hmong and percentage of population with self-care disability in the United States with a correlation coefficient (R) of -0.343 and weighted average of 2.4%. On average, for every 1% (one percent) increase in Hmong within a typical geography, there is a decrease of 1.0% in percentage of population with self-care disability.
Hmong Self-Care Disability
It is essential to understand that the correlation between the percentage of Hmong and percentage of population with self-care disability does not imply a direct cause-and-effect relationship. It remains uncertain whether the presence of Hmong influences an upward or downward trend in the level of percentage of population with self-care disability within an area, or if Hmong simply ended up residing in those areas with higher or lower levels of percentage of population with self-care disability due to other factors.

Demographics Similar to Hmong by Self-Care Disability

In terms of self-care disability, the demographic groups most similar to Hmong are Colombian (2.4%, a difference of 0.030%), Immigrants from Morocco (2.4%, a difference of 0.040%), Immigrants from North America (2.4%, a difference of 0.040%), Immigrants from Hungary (2.4%, a difference of 0.040%), and Immigrants from Nigeria (2.4%, a difference of 0.050%).
DemographicsRating | RankSelf-Care Disability
Immigrants from Sierra Leone
91.8
/100
|
#119
Exceptional
2.4%
Uruguayans
91.5
/100
|
#120
Exceptional
2.4%
Peruvians
91.3
/100
|
#121
Exceptional
2.4%
Belgians
90.9
/100
|
#122
Exceptional
2.4%
Immigrants from Nigeria
90.3
/100
|
#123
Exceptional
2.4%
Immigrants from Morocco
90.2
/100
|
#124
Exceptional
2.4%
Immigrants from North America
90.2
/100
|
#124
Exceptional
2.4%
Hmong
89.9
/100
|
#126
Excellent
2.4%
Colombians
89.7
/100
|
#127
Excellent
2.4%
Immigrants from Hungary
89.6
/100
|
#128
Excellent
2.4%
Immigrants from Romania
89.3
/100
|
#129
Excellent
2.4%
Immigrants from Austria
89.0
/100
|
#130
Excellent
2.4%
Poles
88.9
/100
|
#131
Excellent
2.4%
Immigrants from South America
88.8
/100
|
#132
Excellent
2.4%
Immigrants from Colombia
88.5
/100
|
#133
Excellent
2.4%

Hmong Self-Care Disability Correlation Summary

MeasurementHmong DataSelf-Care Disability Data
Minimum0.0014%0.65%
Maximum1.4%5.0%
Range1.4%4.4%
Mean0.27%2.4%
Median0.14%2.4%
Interquartile 25% (IQ1)0.076%1.8%
Interquartile 75% (IQ3)0.43%3.0%
Interquartile Range (IQR)0.35%1.1%
Standard Deviation (Sample)0.30%0.92%
Standard Deviation (Population)0.30%0.91%

Correlation Details

Hmong PercentileSample SizeSelf-Care Disability
[
0.0%
-
0.5%
]
0.0014%
20,776,2973.0%
[
0.0%
-
0.5%
]
0.011%
606,5872.5%
[
0.0%
-
0.5%
]
0.018%
619,8192.1%
[
0.0%
-
0.5%
]
0.024%
529,1352.1%
[
0.0%
-
0.5%
]
0.031%
540,1312.4%
[
0.0%
-
0.5%
]
0.038%
194,4453.1%
[
0.0%
-
0.5%
]
0.047%
199,1261.6%
[
0.0%
-
0.5%
]
0.053%
232,7933.4%
[
0.0%
-
0.5%
]
0.058%
35,9763.2%
[
0.0%
-
0.5%
]
0.076%
17,1173.7%
[
0.0%
-
0.5%
]
0.080%
73,7352.1%
[
0.0%
-
0.5%
]
0.084%
41,8492.1%
[
0.0%
-
0.5%
]
0.092%
60,9862.7%
[
0.0%
-
0.5%
]
0.099%
51,7652.8%
[
0.0%
-
0.5%
]
0.11%
103,0801.8%
[
0.0%
-
0.5%
]
0.11%
49,7472.7%
[
0.0%
-
0.5%
]
0.12%
72,4352.9%
[
0.0%
-
0.5%
]
0.13%
15,7790.82%
[
0.0%
-
0.5%
]
0.14%
38,9641.8%
[
0.0%
-
0.5%
]
0.14%
25,6251.1%
[
0.0%
-
0.5%
]
0.15%
39,1822.5%
[
0.0%
-
0.5%
]
0.17%
25,1762.0%
[
0.0%
-
0.5%
]
0.18%
51,9263.2%
[
0.0%
-
0.5%
]
0.21%
12,8923.5%
[
0.0%
-
0.5%
]
0.22%
50,2982.1%
[
0.0%
-
0.5%
]
0.28%
2,5345.0%
[
0.0%
-
0.5%
]
0.28%
15,6282.6%
[
0.0%
-
0.5%
]
0.36%
44,0732.2%
[
0.0%
-
0.5%
]
0.43%
8,4183.3%
[
0.0%
-
0.5%
]
0.46%
4,9653.6%
[
0.5%
-
1.0%
]
0.50%
7960.65%
[
0.5%
-
1.0%
]
0.51%
64,9522.7%
[
0.5%
-
1.0%
]
0.53%
7,5670.97%
[
0.5%
-
1.0%
]
0.58%
9,2031.5%
[
0.5%
-
1.0%
]
0.78%
11,5441.7%
[
0.5%
-
1.0%
]
0.82%
10,9972.3%
[
0.5%
-
1.0%
]
0.92%
34,1781.8%
[
1.0%
-
1.5%
]
1.39%
2880.75%