Hmong Married-Couple Family Poverty

COMPARE

Hmong
Race
Ancestry
AfghanAfricanAlaska NativeAlaskan AthabascanAlbanianAleutAlsatianAmericanApacheArabArapahoArgentineanArmenianAssyrian/Chaldean/SyriacAustralianAustrianBahamianBangladeshiBarbadianBasqueBelgianBelizeanBermudanBhutaneseBlackfeetBolivianBrazilianBritishBritish West IndianBulgarianBurmeseCajunCambodianCanadianCape VerdeanCarpatho RusynCelticCentral AmericanCentral American IndianCherokeeCheyenneChickasawChileanChineseChippewaChoctawColombianColvilleComancheCosta RicanCreeCreekCroatianCrowCubanCypriotCzechCzechoslovakianDanishDelawareDominicanDutchDutch West IndianEastern EuropeanEcuadorianEgyptianEnglishEstonianEthiopianEuropeanFijianFilipinoFinnishFrenchFrench American IndianFrench CanadianGermanGerman RussianGhanaianGreekGuamanian/ChamorroGuatemalanGuyaneseHaitianHmongHonduranHopiHoumaHungarianIcelanderIndian (Asian)IndonesianInupiatIranianIraqiIrishIroquoisIsraeliItalianJamaicanJapaneseJordanianKenyanKiowaKoreanLaotianLatvianLebaneseLiberianLithuanianLumbeeLuxembourgerMacedonianMalaysianMalteseMarshalleseMenomineeMexicanMexican American IndianMongolianMoroccanNative HawaiianNavajoNepaleseNew ZealanderNicaraguanNigerianNorthern EuropeanNorwegianOkinawanOsageOttawaPaiutePakistaniPalestinianPanamanianParaguayanPennsylvania GermanPeruvianPimaPolishPortuguesePotawatomiPuebloPuerto RicanPuget Sound SalishRomanianRussianSalvadoranSamoanScandinavianScotch-IrishScottishSeminoleSenegaleseSerbianShoshoneSierra LeoneanSiouxSlavicSlovakSloveneSomaliSouth AfricanSouth AmericanSouth American IndianSoviet UnionSpaniardSpanishSpanish AmericanSpanish American IndianSri LankanSubsaharan AfricanSudaneseSwedishSwissSyrianTaiwaneseThaiTlingit-HaidaTohono O'OdhamTonganTrinidadian and TobagonianTsimshianTurkishU.S. Virgin IslanderUgandanUkrainianUruguayanUteVenezuelanVietnameseWelshWest IndianYakamaYaquiYugoslavianYumanYup'ikZimbabwean
Immigration
NonimmigrantsImmigrantsAfghanistanAfricaAlbaniaArgentinaArmeniaAsiaAustraliaAustriaBahamasBangladeshBarbadosBelarusBelgiumBelizeBoliviaBosnia and HerzegovinaBrazilBulgariaBurma/MyanmarCabo VerdeCambodiaCameroonCanadaCaribbeanCentral AmericaChileChinaColombiaCongoCosta RicaCroatiaCubaCzechoslovakiaDenmarkDominicaDominican RepublicEastern AfricaEastern AsiaEastern EuropeEcuadorEgyptEl SalvadorEnglandEritreaEthiopiaEuropeFijiFranceGermanyGhanaGreeceGrenadaGuatemalaGuyanaHaitiHondurasHong KongHungaryIndiaIndonesiaIranIraqIrelandIsraelItalyJamaicaJapanJordanKazakhstanKenyaKoreaKuwaitLaosLatin AmericaLatviaLebanonLiberiaLithuaniaMalaysiaMexicoMicronesiaMiddle AfricaMoldovaMoroccoNepalNetherlandsNicaraguaNigeriaNorth AmericaNorth MacedoniaNorthern AfricaNorthern EuropeNorwayOceaniaPakistanPanamaPeruPhilippinesPolandPortugalRomaniaRussiaSaudi ArabiaScotlandSenegalSerbiaSierra LeoneSingaporeSomaliaSouth AfricaSouth AmericaSouth Central AsiaSouth Eastern AsiaSouthern EuropeSpainSri LankaSt. Vincent and the GrenadinesSudanSwedenSwitzerlandSyriaTaiwanThailandTrinidad and TobagoTurkeyUgandaUkraineUruguayUzbekistanVenezuelaVietnamWest IndiesWestern AfricaWestern AsiaWestern EuropeYemenZaireZimbabweAzores
Select to Compare
Race
Ancestry
AfghanAfricanAlaska NativeAlaskan AthabascanAlbanianAleutAlsatianAmericanApacheArabArapahoArgentineanArmenianAssyrian/Chaldean/SyriacAustralianAustrianBahamianBangladeshiBarbadianBasqueBelgianBelizeanBermudanBhutaneseBlackfeetBolivianBrazilianBritishBritish West IndianBulgarianBurmeseCajunCambodianCanadianCape VerdeanCarpatho RusynCelticCentral AmericanCentral American IndianCherokeeCheyenneChickasawChileanChineseChippewaChoctawColombianColvilleComancheCosta RicanCreeCreekCroatianCrowCubanCypriotCzechCzechoslovakianDanishDelawareDominicanDutchDutch West IndianEastern EuropeanEcuadorianEgyptianEnglishEstonianEthiopianEuropeanFijianFilipinoFinnishFrenchFrench American IndianFrench CanadianGermanGerman RussianGhanaianGreekGuamanian/ChamorroGuatemalanGuyaneseHaitianHonduranHopiHoumaHungarianIcelanderIndian (Asian)IndonesianInupiatIranianIraqiIrishIroquoisIsraeliItalianJamaicanJapaneseJordanianKenyanKiowaKoreanLaotianLatvianLebaneseLiberianLithuanianLumbeeLuxembourgerMacedonianMalaysianMalteseMarshalleseMenomineeMexicanMexican American IndianMongolianMoroccanNative HawaiianNavajoNepaleseNew ZealanderNicaraguanNigerianNorthern EuropeanNorwegianOkinawanOsageOttawaPaiutePakistaniPalestinianPanamanianParaguayanPennsylvania GermanPeruvianPimaPolishPortuguesePotawatomiPuebloPuerto RicanPuget Sound SalishRomanianRussianSalvadoranSamoanScandinavianScotch-IrishScottishSeminoleSenegaleseSerbianShoshoneSierra LeoneanSiouxSlavicSlovakSloveneSomaliSouth AfricanSouth AmericanSouth American IndianSoviet UnionSpaniardSpanishSpanish AmericanSpanish American IndianSri LankanSubsaharan AfricanSudaneseSwedishSwissSyrianTaiwaneseThaiTlingit-HaidaTohono O'OdhamTonganTrinidadian and TobagonianTsimshianTurkishU.S. Virgin IslanderUgandanUkrainianUruguayanUteVenezuelanVietnameseWelshWest IndianYakamaYaquiYugoslavianYumanYup'ikZimbabwean
Immigration
NonimmigrantsImmigrantsAfghanistanAfricaAlbaniaArgentinaArmeniaAsiaAustraliaAustriaBahamasBangladeshBarbadosBelarusBelgiumBelizeBoliviaBosnia and HerzegovinaBrazilBulgariaBurma/MyanmarCabo VerdeCambodiaCameroonCanadaCaribbeanCentral AmericaChileChinaColombiaCongoCosta RicaCroatiaCubaCzechoslovakiaDenmarkDominicaDominican RepublicEastern AfricaEastern AsiaEastern EuropeEcuadorEgyptEl SalvadorEnglandEritreaEthiopiaEuropeFijiFranceGermanyGhanaGreeceGrenadaGuatemalaGuyanaHaitiHondurasHong KongHungaryIndiaIndonesiaIranIraqIrelandIsraelItalyJamaicaJapanJordanKazakhstanKenyaKoreaKuwaitLaosLatin AmericaLatviaLebanonLiberiaLithuaniaMalaysiaMexicoMicronesiaMiddle AfricaMoldovaMoroccoNepalNetherlandsNicaraguaNigeriaNorth AmericaNorth MacedoniaNorthern AfricaNorthern EuropeNorwayOceaniaPakistanPanamaPeruPhilippinesPolandPortugalRomaniaRussiaSaudi ArabiaScotlandSenegalSerbiaSierra LeoneSingaporeSomaliaSouth AfricaSouth AmericaSouth Central AsiaSouth Eastern AsiaSouthern EuropeSpainSri LankaSt. Vincent and the GrenadinesSudanSwedenSwitzerlandSyriaTaiwanThailandTrinidad and TobagoTurkeyUgandaUkraineUruguayUzbekistanVenezuelaVietnamWest IndiesWestern AfricaWestern AsiaWestern EuropeYemenZaireZimbabweAzores
Married-Couple Family Poverty
Income
Poverty
Unemployment
Labor Participation
Family Structure
Vehicle Availability
Education Level
Disability

Hmong Married-Couple Family Poverty
Excellent

5.0%
POVERTY | MARRIED-COUPLE FAMILIES
83.2/ 100
METRIC RATING
144th/ 347
METRIC RANK

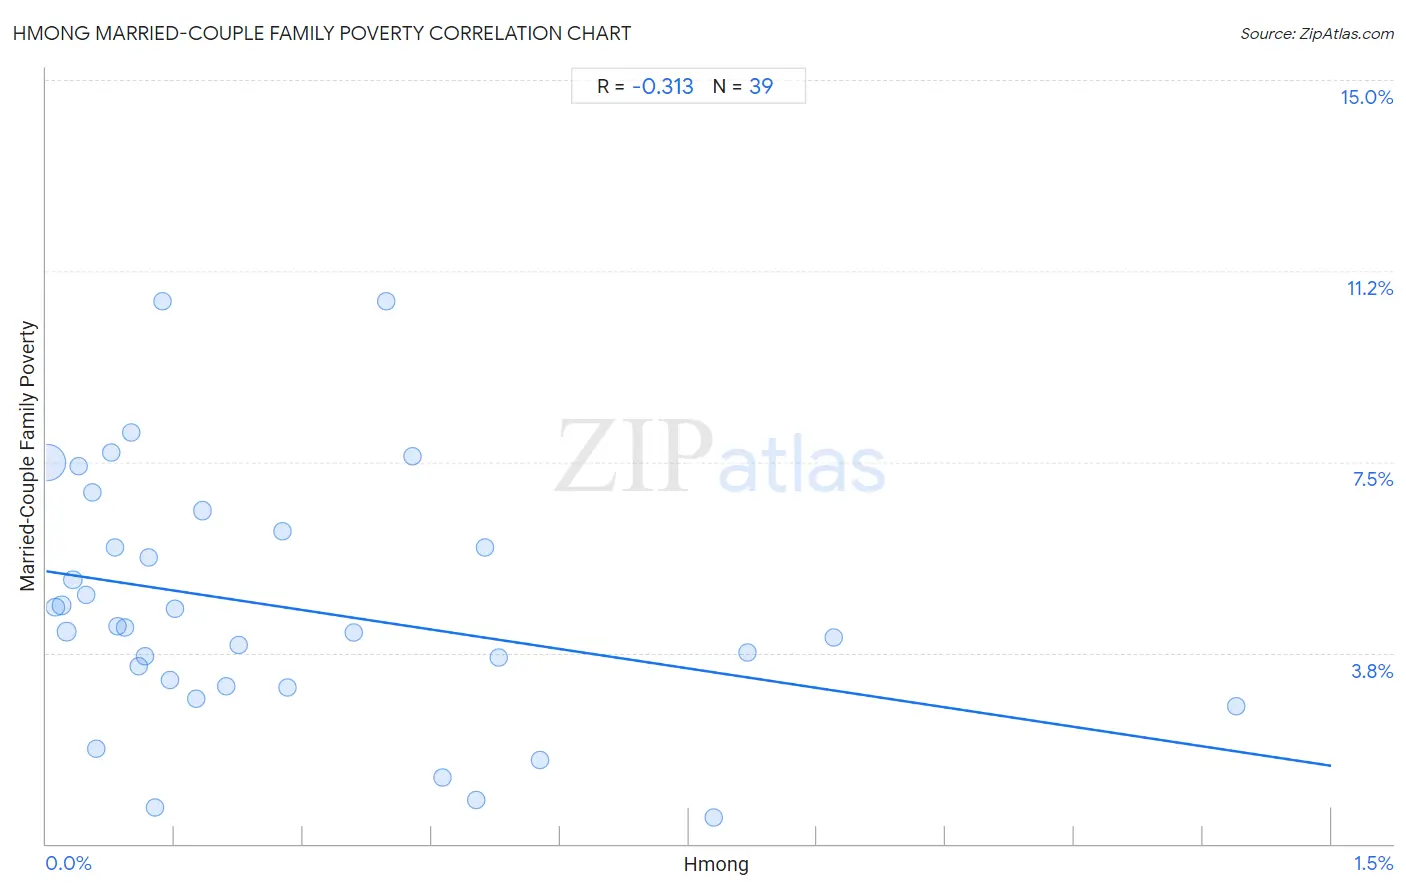
Hmong Married-Couple Family Poverty Correlation Chart

The statistical analysis conducted on geographies consisting of 24,678,157 people shows a mild negative correlation between the proportion of Hmong and poverty level among married-couple families in the United States with a correlation coefficient (R) of -0.313 and weighted average of 5.0%. On average, for every 1% (one percent) increase in Hmong within a typical geography, there is a decrease of 2.5% in poverty level among married-couple families.
Hmong Married-Couple Family Poverty
It is essential to understand that the correlation between the percentage of Hmong and poverty level among married-couple families does not imply a direct cause-and-effect relationship. It remains uncertain whether the presence of Hmong influences an upward or downward trend in the level of poverty level among married-couple families within an area, or if Hmong simply ended up residing in those areas with higher or lower levels of poverty level among married-couple families due to other factors.

Demographics Similar to Hmong by Married-Couple Family Poverty

In terms of married-couple family poverty, the demographic groups most similar to Hmong are Immigrants from Egypt (5.0%, a difference of 0.050%), Immigrants from Brazil (5.0%, a difference of 0.32%), Immigrants from China (5.0%, a difference of 0.32%), Immigrants from Portugal (5.0%, a difference of 0.37%), and German Russian (5.0%, a difference of 0.43%).
DemographicsRating | RankMarried-Couple Family Poverty
Guamanians/Chamorros
86.5
/100
|
#137
Excellent
4.9%
Chileans
86.0
/100
|
#138
Excellent
4.9%
German Russians
85.1
/100
|
#139
Excellent
5.0%
Immigrants from Portugal
84.8
/100
|
#140
Excellent
5.0%
Immigrants from Brazil
84.6
/100
|
#141
Excellent
5.0%
Immigrants from China
84.6
/100
|
#142
Excellent
5.0%
Immigrants from Egypt
83.4
/100
|
#143
Excellent
5.0%
Hmong
83.2
/100
|
#144
Excellent
5.0%
Immigrants from Spain
79.9
/100
|
#145
Good
5.0%
Mongolians
79.8
/100
|
#146
Good
5.0%
Syrians
78.7
/100
|
#147
Good
5.0%
Immigrants from Russia
78.7
/100
|
#148
Good
5.0%
Immigrants from Oceania
78.6
/100
|
#149
Good
5.0%
Brazilians
78.3
/100
|
#150
Good
5.0%
Immigrants from Cameroon
77.3
/100
|
#151
Good
5.0%

Hmong Married-Couple Family Poverty Correlation Summary

MeasurementHmong DataMarried-Couple Family Poverty Data
Minimum0.0014%0.50%
Maximum1.4%10.7%
Range1.4%10.2%
Mean0.27%4.7%
Median0.14%4.3%
Interquartile 25% (IQ1)0.076%3.1%
Interquartile 75% (IQ3)0.43%6.1%
Interquartile Range (IQR)0.35%3.0%
Standard Deviation (Sample)0.30%2.4%
Standard Deviation (Population)0.30%2.4%

Correlation Details

Hmong PercentileSample SizeMarried-Couple Family Poverty
[
0.0%
-
0.5%
]
0.0014%
20,776,2977.5%
[
0.0%
-
0.5%
]
0.011%
606,5874.6%
[
0.0%
-
0.5%
]
0.018%
619,8194.7%
[
0.0%
-
0.5%
]
0.024%
529,1354.2%
[
0.0%
-
0.5%
]
0.031%
540,1315.2%
[
0.0%
-
0.5%
]
0.038%
194,4457.4%
[
0.0%
-
0.5%
]
0.047%
199,1264.9%
[
0.0%
-
0.5%
]
0.053%
232,7936.9%
[
0.0%
-
0.5%
]
0.058%
35,9761.9%
[
0.0%
-
0.5%
]
0.076%
17,1177.7%
[
0.0%
-
0.5%
]
0.080%
73,7355.8%
[
0.0%
-
0.5%
]
0.084%
41,8494.3%
[
0.0%
-
0.5%
]
0.092%
60,9864.3%
[
0.0%
-
0.5%
]
0.099%
51,7658.1%
[
0.0%
-
0.5%
]
0.11%
103,0803.5%
[
0.0%
-
0.5%
]
0.11%
49,7473.7%
[
0.0%
-
0.5%
]
0.12%
72,4355.6%
[
0.0%
-
0.5%
]
0.13%
13,4250.71%
[
0.0%
-
0.5%
]
0.14%
38,96410.6%
[
0.0%
-
0.5%
]
0.14%
25,6253.2%
[
0.0%
-
0.5%
]
0.15%
39,1824.6%
[
0.0%
-
0.5%
]
0.17%
25,1762.8%
[
0.0%
-
0.5%
]
0.18%
51,9266.5%
[
0.0%
-
0.5%
]
0.21%
12,8923.1%
[
0.0%
-
0.5%
]
0.22%
50,2983.9%
[
0.0%
-
0.5%
]
0.28%
2,5346.1%
[
0.0%
-
0.5%
]
0.28%
15,6283.1%
[
0.0%
-
0.5%
]
0.36%
44,0734.2%
[
0.0%
-
0.5%
]
0.40%
50310.7%
[
0.0%
-
0.5%
]
0.43%
8,4187.6%
[
0.0%
-
0.5%
]
0.46%
4,9651.3%
[
0.5%
-
1.0%
]
0.50%
7960.87%
[
0.5%
-
1.0%
]
0.51%
64,9525.8%
[
0.5%
-
1.0%
]
0.53%
7,5673.7%
[
0.5%
-
1.0%
]
0.58%
9,2031.6%
[
0.5%
-
1.0%
]
0.78%
11,5440.50%
[
0.5%
-
1.0%
]
0.82%
10,9973.8%
[
0.5%
-
1.0%
]
0.92%
34,1784.1%
[
1.0%
-
1.5%
]
1.39%
2882.7%