Hmong GED/Equivalency

COMPARE

Hmong
Race
Ancestry
AfghanAfricanAlaska NativeAlaskan AthabascanAlbanianAleutAlsatianAmericanApacheArabArapahoArgentineanArmenianAssyrian/Chaldean/SyriacAustralianAustrianBahamianBangladeshiBarbadianBasqueBelgianBelizeanBermudanBhutaneseBlackfeetBolivianBrazilianBritishBritish West IndianBulgarianBurmeseCajunCambodianCanadianCape VerdeanCarpatho RusynCelticCentral AmericanCentral American IndianCherokeeCheyenneChickasawChileanChineseChippewaChoctawColombianColvilleComancheCosta RicanCreeCreekCroatianCrowCubanCypriotCzechCzechoslovakianDanishDelawareDominicanDutchDutch West IndianEastern EuropeanEcuadorianEgyptianEnglishEstonianEthiopianEuropeanFijianFilipinoFinnishFrenchFrench American IndianFrench CanadianGermanGerman RussianGhanaianGreekGuamanian/ChamorroGuatemalanGuyaneseHaitianHmongHonduranHopiHoumaHungarianIcelanderIndian (Asian)IndonesianInupiatIranianIraqiIrishIroquoisIsraeliItalianJamaicanJapaneseJordanianKenyanKiowaKoreanLaotianLatvianLebaneseLiberianLithuanianLumbeeLuxembourgerMacedonianMalaysianMalteseMarshalleseMenomineeMexicanMexican American IndianMongolianMoroccanNative HawaiianNavajoNepaleseNew ZealanderNicaraguanNigerianNorthern EuropeanNorwegianOkinawanOsageOttawaPaiutePakistaniPalestinianPanamanianParaguayanPennsylvania GermanPeruvianPimaPolishPortuguesePotawatomiPuebloPuerto RicanPuget Sound SalishRomanianRussianSalvadoranSamoanScandinavianScotch-IrishScottishSeminoleSenegaleseSerbianShoshoneSierra LeoneanSiouxSlavicSlovakSloveneSomaliSouth AfricanSouth AmericanSouth American IndianSoviet UnionSpaniardSpanishSpanish AmericanSpanish American IndianSri LankanSubsaharan AfricanSudaneseSwedishSwissSyrianTaiwaneseThaiTlingit-HaidaTohono O'OdhamTonganTrinidadian and TobagonianTsimshianTurkishU.S. Virgin IslanderUgandanUkrainianUruguayanUteVenezuelanVietnameseWelshWest IndianYakamaYaquiYugoslavianYumanYup'ikZimbabwean
Immigration
NonimmigrantsImmigrantsAfghanistanAfricaAlbaniaArgentinaArmeniaAsiaAustraliaAustriaBahamasBangladeshBarbadosBelarusBelgiumBelizeBoliviaBosnia and HerzegovinaBrazilBulgariaBurma/MyanmarCabo VerdeCambodiaCameroonCanadaCaribbeanCentral AmericaChileChinaColombiaCongoCosta RicaCroatiaCubaCzechoslovakiaDenmarkDominicaDominican RepublicEastern AfricaEastern AsiaEastern EuropeEcuadorEgyptEl SalvadorEnglandEritreaEthiopiaEuropeFijiFranceGermanyGhanaGreeceGrenadaGuatemalaGuyanaHaitiHondurasHong KongHungaryIndiaIndonesiaIranIraqIrelandIsraelItalyJamaicaJapanJordanKazakhstanKenyaKoreaKuwaitLaosLatin AmericaLatviaLebanonLiberiaLithuaniaMalaysiaMexicoMicronesiaMiddle AfricaMoldovaMoroccoNepalNetherlandsNicaraguaNigeriaNorth AmericaNorth MacedoniaNorthern AfricaNorthern EuropeNorwayOceaniaPakistanPanamaPeruPhilippinesPolandPortugalRomaniaRussiaSaudi ArabiaScotlandSenegalSerbiaSierra LeoneSingaporeSomaliaSouth AfricaSouth AmericaSouth Central AsiaSouth Eastern AsiaSouthern EuropeSpainSri LankaSt. Vincent and the GrenadinesSudanSwedenSwitzerlandSyriaTaiwanThailandTrinidad and TobagoTurkeyUgandaUkraineUruguayUzbekistanVenezuelaVietnamWest IndiesWestern AfricaWestern AsiaWestern EuropeYemenZaireZimbabweAzores
Select to Compare
Race
Ancestry
AfghanAfricanAlaska NativeAlaskan AthabascanAlbanianAleutAlsatianAmericanApacheArabArapahoArgentineanArmenianAssyrian/Chaldean/SyriacAustralianAustrianBahamianBangladeshiBarbadianBasqueBelgianBelizeanBermudanBhutaneseBlackfeetBolivianBrazilianBritishBritish West IndianBulgarianBurmeseCajunCambodianCanadianCape VerdeanCarpatho RusynCelticCentral AmericanCentral American IndianCherokeeCheyenneChickasawChileanChineseChippewaChoctawColombianColvilleComancheCosta RicanCreeCreekCroatianCrowCubanCypriotCzechCzechoslovakianDanishDelawareDominicanDutchDutch West IndianEastern EuropeanEcuadorianEgyptianEnglishEstonianEthiopianEuropeanFijianFilipinoFinnishFrenchFrench American IndianFrench CanadianGermanGerman RussianGhanaianGreekGuamanian/ChamorroGuatemalanGuyaneseHaitianHonduranHopiHoumaHungarianIcelanderIndian (Asian)IndonesianInupiatIranianIraqiIrishIroquoisIsraeliItalianJamaicanJapaneseJordanianKenyanKiowaKoreanLaotianLatvianLebaneseLiberianLithuanianLumbeeLuxembourgerMacedonianMalaysianMalteseMarshalleseMenomineeMexicanMexican American IndianMongolianMoroccanNative HawaiianNavajoNepaleseNew ZealanderNicaraguanNigerianNorthern EuropeanNorwegianOkinawanOsageOttawaPaiutePakistaniPalestinianPanamanianParaguayanPennsylvania GermanPeruvianPimaPolishPortuguesePotawatomiPuebloPuerto RicanPuget Sound SalishRomanianRussianSalvadoranSamoanScandinavianScotch-IrishScottishSeminoleSenegaleseSerbianShoshoneSierra LeoneanSiouxSlavicSlovakSloveneSomaliSouth AfricanSouth AmericanSouth American IndianSoviet UnionSpaniardSpanishSpanish AmericanSpanish American IndianSri LankanSubsaharan AfricanSudaneseSwedishSwissSyrianTaiwaneseThaiTlingit-HaidaTohono O'OdhamTonganTrinidadian and TobagonianTsimshianTurkishU.S. Virgin IslanderUgandanUkrainianUruguayanUteVenezuelanVietnameseWelshWest IndianYakamaYaquiYugoslavianYumanYup'ikZimbabwean
Immigration
NonimmigrantsImmigrantsAfghanistanAfricaAlbaniaArgentinaArmeniaAsiaAustraliaAustriaBahamasBangladeshBarbadosBelarusBelgiumBelizeBoliviaBosnia and HerzegovinaBrazilBulgariaBurma/MyanmarCabo VerdeCambodiaCameroonCanadaCaribbeanCentral AmericaChileChinaColombiaCongoCosta RicaCroatiaCubaCzechoslovakiaDenmarkDominicaDominican RepublicEastern AfricaEastern AsiaEastern EuropeEcuadorEgyptEl SalvadorEnglandEritreaEthiopiaEuropeFijiFranceGermanyGhanaGreeceGrenadaGuatemalaGuyanaHaitiHondurasHong KongHungaryIndiaIndonesiaIranIraqIrelandIsraelItalyJamaicaJapanJordanKazakhstanKenyaKoreaKuwaitLaosLatin AmericaLatviaLebanonLiberiaLithuaniaMalaysiaMexicoMicronesiaMiddle AfricaMoldovaMoroccoNepalNetherlandsNicaraguaNigeriaNorth AmericaNorth MacedoniaNorthern AfricaNorthern EuropeNorwayOceaniaPakistanPanamaPeruPhilippinesPolandPortugalRomaniaRussiaSaudi ArabiaScotlandSenegalSerbiaSierra LeoneSingaporeSomaliaSouth AfricaSouth AmericaSouth Central AsiaSouth Eastern AsiaSouthern EuropeSpainSri LankaSt. Vincent and the GrenadinesSudanSwedenSwitzerlandSyriaTaiwanThailandTrinidad and TobagoTurkeyUgandaUkraineUruguayUzbekistanVenezuelaVietnamWest IndiesWestern AfricaWestern AsiaWestern EuropeYemenZaireZimbabweAzores
GED/Equivalency
Income
Poverty
Unemployment
Labor Participation
Family Structure
Vehicle Availability
Education Level
Disability

Hmong GED/Equivalency
Poor

84.9%
GED/EQUIVALENCY
13.1/ 100
METRIC RATING
207th/ 347
METRIC RANK

Hmong GED/Equivalency Correlation Chart

The statistical analysis conducted on geographies consisting of 24,672,093 people shows a slight positive correlation between the proportion of Hmong and percentage of population with at least ged/equivalency education in the United States with a correlation coefficient (R) of 0.057 and weighted average of 84.9%. On average, for every 1% (one percent) increase in Hmong within a typical geography, there is an increase of 1.1% in percentage of population with at least ged/equivalency education.
Hmong GED/Equivalency
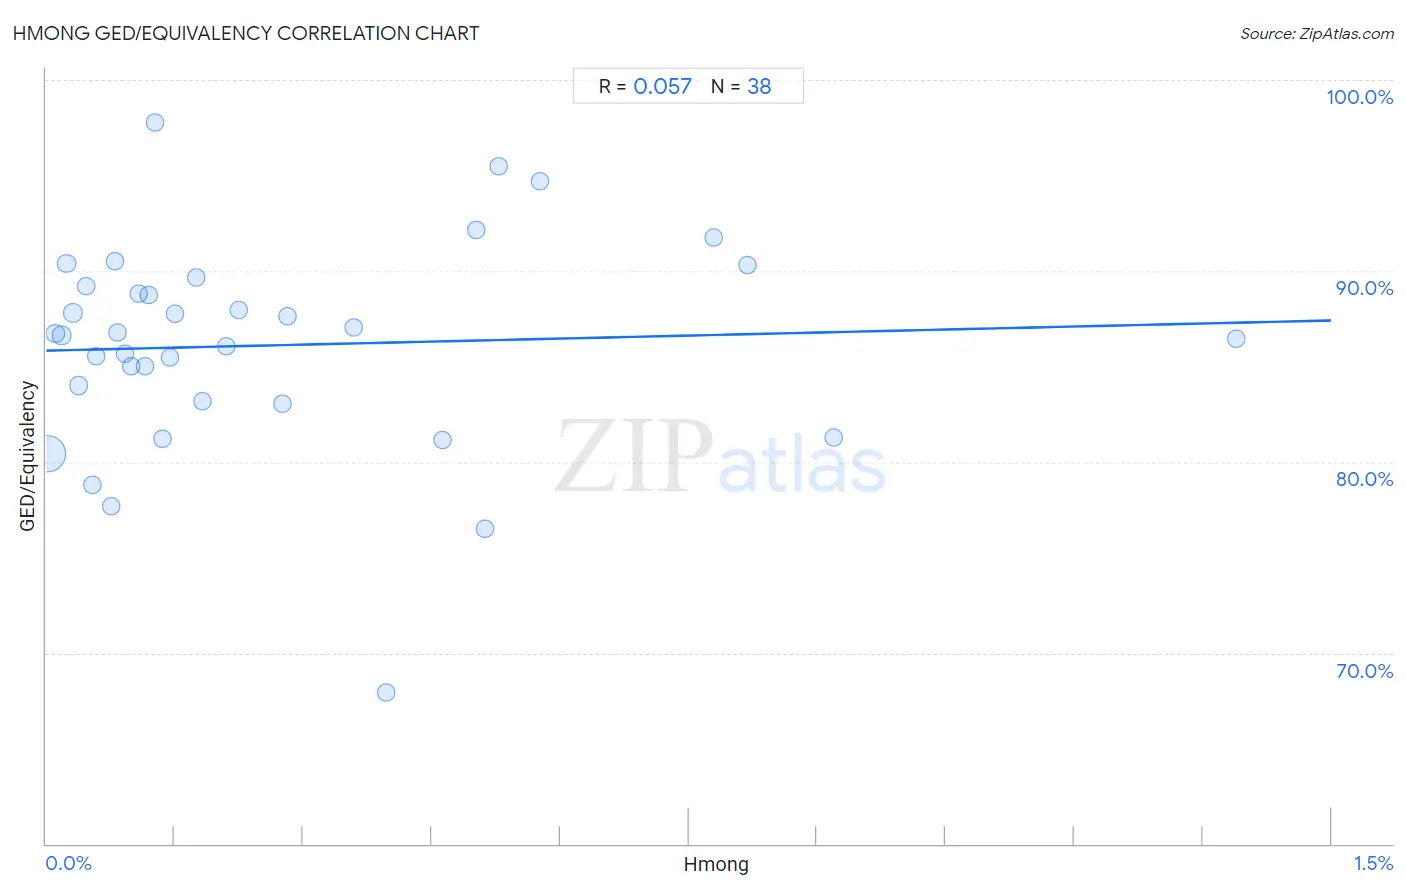
It is essential to understand that the correlation between the percentage of Hmong and percentage of population with at least ged/equivalency education does not imply a direct cause-and-effect relationship. It remains uncertain whether the presence of Hmong influences an upward or downward trend in the level of percentage of population with at least ged/equivalency education within an area, or if Hmong simply ended up residing in those areas with higher or lower levels of percentage of population with at least ged/equivalency education due to other factors.

Demographics Similar to Hmong by GED/Equivalency

In terms of ged/equivalency, the demographic groups most similar to Hmong are Samoan (84.9%, a difference of 0.020%), Marshallese (84.9%, a difference of 0.030%), Colombian (84.9%, a difference of 0.040%), Immigrants from Cameroon (84.9%, a difference of 0.050%), and Liberian (85.0%, a difference of 0.060%).
DemographicsRating | RankGED/Equivalency
Uruguayans
16.0
/100
|
#200
Poor
85.0%
Portuguese
15.9
/100
|
#201
Poor
85.0%
Cree
15.9
/100
|
#202
Poor
85.0%
Panamanians
15.3
/100
|
#203
Poor
85.0%
Hawaiians
15.2
/100
|
#204
Poor
85.0%
Liberians
14.6
/100
|
#205
Poor
85.0%
Samoans
13.7
/100
|
#206
Poor
84.9%
Hmong
13.1
/100
|
#207
Poor
84.9%
Marshallese
12.5
/100
|
#208
Poor
84.9%
Colombians
12.3
/100
|
#209
Poor
84.9%
Immigrants from Cameroon
12.1
/100
|
#210
Poor
84.9%
South Americans
10.9
/100
|
#211
Poor
84.8%
Immigrants from Somalia
10.6
/100
|
#212
Poor
84.8%
Immigrants from Philippines
10.0
/100
|
#213
Poor
84.8%
Osage
9.5
/100
|
#214
Tragic
84.8%

Hmong GED/Equivalency Correlation Summary

MeasurementHmong DataGED/Equivalency Data
Minimum0.0014%67.9%
Maximum1.4%97.8%
Range1.4%29.9%
Mean0.27%86.1%
Median0.14%86.7%
Interquartile 25% (IQ1)0.076%83.2%
Interquartile 75% (IQ3)0.40%89.2%
Interquartile Range (IQR)0.32%6.0%
Standard Deviation (Sample)0.30%5.6%
Standard Deviation (Population)0.30%5.5%

Correlation Details

Hmong PercentileSample SizeGED/Equivalency
[
0.0%
-
0.5%
]
0.0014%
20,776,29780.4%
[
0.0%
-
0.5%
]
0.011%
606,58786.7%
[
0.0%
-
0.5%
]
0.018%
619,81986.6%
[
0.0%
-
0.5%
]
0.024%
529,13590.4%
[
0.0%
-
0.5%
]
0.031%
540,13187.8%
[
0.0%
-
0.5%
]
0.038%
194,44584.0%
[
0.0%
-
0.5%
]
0.047%
199,12689.2%
[
0.0%
-
0.5%
]
0.053%
232,79378.8%
[
0.0%
-
0.5%
]
0.058%
35,97685.6%
[
0.0%
-
0.5%
]
0.076%
17,11777.7%
[
0.0%
-
0.5%
]
0.080%
73,73590.5%
[
0.0%
-
0.5%
]
0.084%
41,84986.8%
[
0.0%
-
0.5%
]
0.092%
60,98685.7%
[
0.0%
-
0.5%
]
0.099%
51,76585.0%
[
0.0%
-
0.5%
]
0.11%
103,08088.8%
[
0.0%
-
0.5%
]
0.11%
49,74785.0%
[
0.0%
-
0.5%
]
0.12%
72,43588.7%
[
0.0%
-
0.5%
]
0.13%
15,77997.8%
[
0.0%
-
0.5%
]
0.14%
38,96481.2%
[
0.0%
-
0.5%
]
0.14%
25,62585.5%
[
0.0%
-
0.5%
]
0.15%
39,18287.8%
[
0.0%
-
0.5%
]
0.17%
25,17689.6%
[
0.0%
-
0.5%
]
0.18%
51,92683.2%
[
0.0%
-
0.5%
]
0.21%
12,89286.1%
[
0.0%
-
0.5%
]
0.22%
50,29887.9%
[
0.0%
-
0.5%
]
0.28%
2,53483.0%
[
0.0%
-
0.5%
]
0.28%
15,62887.6%
[
0.0%
-
0.5%
]
0.36%
44,07387.0%
[
0.0%
-
0.5%
]
0.40%
50367.9%
[
0.0%
-
0.5%
]
0.46%
4,96581.1%
[
0.5%
-
1.0%
]
0.50%
79692.1%
[
0.5%
-
1.0%
]
0.51%
64,95276.5%
[
0.5%
-
1.0%
]
0.53%
7,56795.5%
[
0.5%
-
1.0%
]
0.58%
9,20394.7%
[
0.5%
-
1.0%
]
0.78%
11,54491.7%
[
0.5%
-
1.0%
]
0.82%
10,99790.3%
[
0.5%
-
1.0%
]
0.92%
34,17881.3%
[
1.0%
-
1.5%
]
1.39%
28886.4%