Hawaiian Disability Age Under 5
COMPARE
Hawaiian
Select to Compare
Disability Age Under 5
Hawaiian Disability Age Under 5
1.2%
DISABILITY | AGE UNDER 5
68.5/ 100
METRIC RATING
156th/ 347
METRIC RANK
Hawaiian Disability Age Under 5 Correlation Chart
The statistical analysis conducted on geographies consisting of 194,372,876 people shows a mild positive correlation between the proportion of Hawaiians and percentage of population with a disability under the age of 5 in the United States with a correlation coefficient (R) of 0.362 and weighted average of 1.2%. On average, for every 1% (one percent) increase in Hawaiians within a typical geography, there is an increase of 0.042% in percentage of population with a disability under the age of 5.
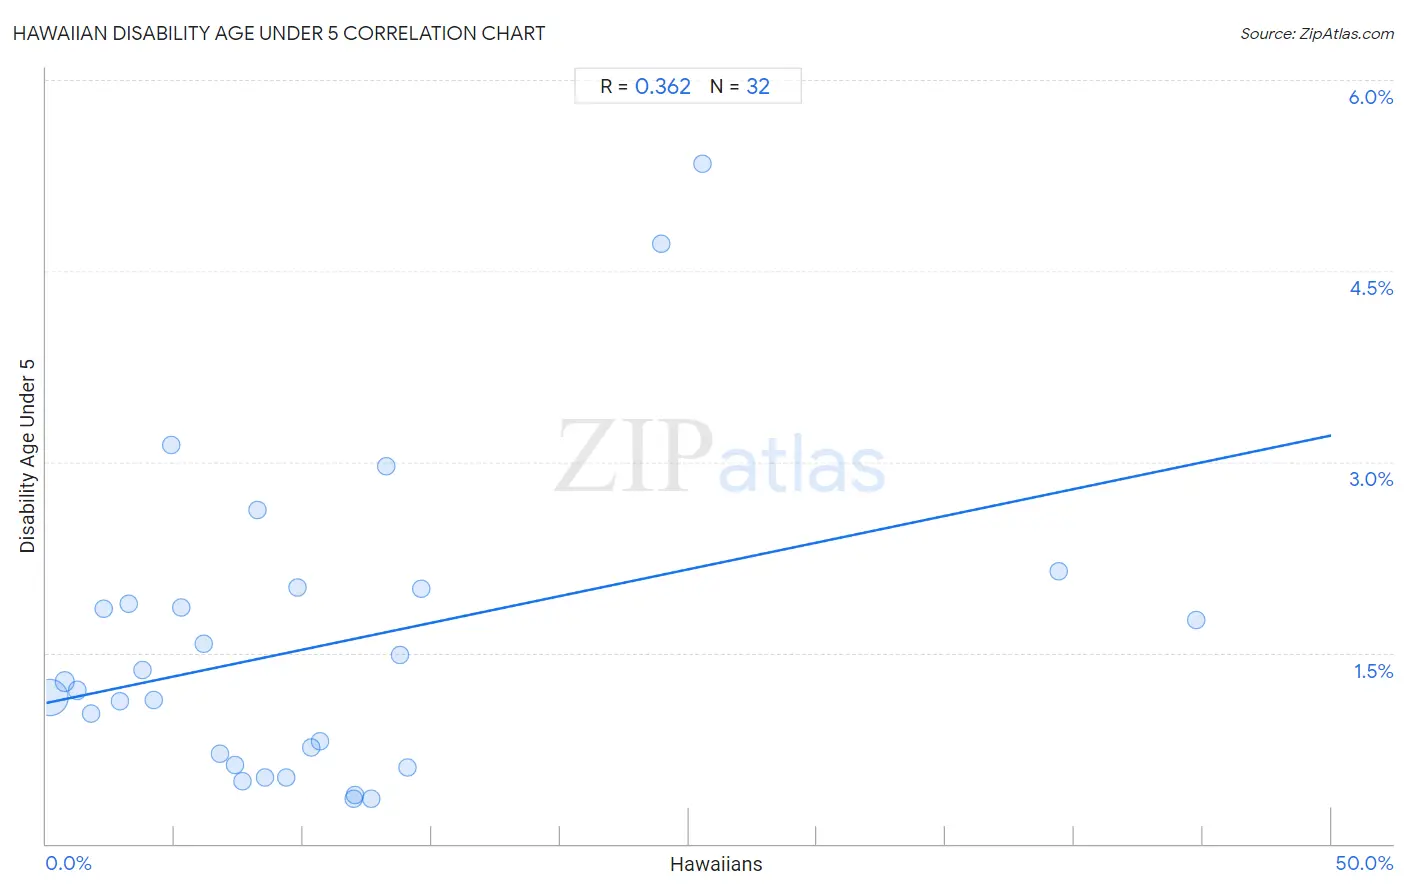
It is essential to understand that the correlation between the percentage of Hawaiians and percentage of population with a disability under the age of 5 does not imply a direct cause-and-effect relationship. It remains uncertain whether the presence of Hawaiians influences an upward or downward trend in the level of percentage of population with a disability under the age of 5 within an area, or if Hawaiians simply ended up residing in those areas with higher or lower levels of percentage of population with a disability under the age of 5 due to other factors.
Demographics Similar to Hawaiians by Disability Age Under 5
In terms of disability age under 5, the demographic groups most similar to Hawaiians are Immigrants from Ghana (1.2%, a difference of 0.020%), Uruguayan (1.2%, a difference of 0.030%), Immigrants from Thailand (1.2%, a difference of 0.10%), Immigrants from South America (1.2%, a difference of 0.16%), and Arab (1.2%, a difference of 0.22%).
| Demographics | Rating | Rank | Disability Age Under 5 |
| Kenyans | 75.9 /100 | #149 | Good 1.2% |
| South Americans | 75.6 /100 | #150 | Good 1.2% |
| Yaqui | 74.8 /100 | #151 | Good 1.2% |
| Hondurans | 72.5 /100 | #152 | Good 1.2% |
| Immigrants from Thailand | 69.4 /100 | #153 | Good 1.2% |
| Uruguayans | 68.8 /100 | #154 | Good 1.2% |
| Immigrants from Ghana | 68.7 /100 | #155 | Good 1.2% |
| Hawaiians | 68.5 /100 | #156 | Good 1.2% |
| Immigrants from South America | 67.0 /100 | #157 | Good 1.2% |
| Arabs | 66.4 /100 | #158 | Good 1.2% |
| Colombians | 65.8 /100 | #159 | Good 1.2% |
| Immigrants from Latin America | 65.8 /100 | #160 | Good 1.2% |
| Immigrants from Africa | 65.1 /100 | #161 | Good 1.2% |
| Guatemalans | 63.6 /100 | #162 | Good 1.2% |
| Immigrants from Guatemala | 63.2 /100 | #163 | Good 1.2% |
Hawaiian Disability Age Under 5 Correlation Summary
| Measurement | Hawaiian Data | Disability Age Under 5 Data |
| Minimum | 0.13% | 0.35% |
| Maximum | 44.7% | 5.3% |
| Range | 44.6% | 5.0% |
| Mean | 10.6% | 1.6% |
| Median | 8.4% | 1.2% |
| Interquartile 25% (IQ1) | 4.0% | 0.66% |
| Interquartile 75% (IQ3) | 12.9% | 1.9% |
| Interquartile Range (IQR) | 9.0% | 1.3% |
| Standard Deviation (Sample) | 10.2% | 1.2% |
| Standard Deviation (Population) | 10.0% | 1.2% |
Correlation Details
| Hawaiian Percentile | Sample Size | Disability Age Under 5 |
[ 0.0% - 0.5% ] 0.13% | 167,059,036 | 1.1% |
[ 0.5% - 1.0% ] 0.71% | 16,393,347 | 1.3% |
[ 1.0% - 1.5% ] 1.22% | 4,274,152 | 1.2% |
[ 1.5% - 2.0% ] 1.73% | 2,617,726 | 1.0% |
[ 2.0% - 2.5% ] 2.24% | 609,539 | 1.8% |
[ 2.5% - 3.0% ] 2.85% | 746,979 | 1.1% |
[ 3.0% - 3.5% ] 3.21% | 450,129 | 1.9% |
[ 3.5% - 4.0% ] 3.75% | 209,243 | 1.4% |
[ 4.0% - 4.5% ] 4.17% | 303,199 | 1.1% |
[ 4.5% - 5.0% ] 4.85% | 57,735 | 3.1% |
[ 5.0% - 5.5% ] 5.28% | 125,988 | 1.9% |
[ 6.0% - 6.5% ] 6.11% | 52,598 | 1.6% |
[ 6.5% - 7.0% ] 6.78% | 137,530 | 0.71% |
[ 7.0% - 7.5% ] 7.34% | 156,671 | 0.62% |
[ 7.5% - 8.0% ] 7.62% | 86,705 | 0.50% |
[ 8.0% - 8.5% ] 8.21% | 49,975 | 2.6% |
[ 8.5% - 9.0% ] 8.52% | 362,466 | 0.52% |
[ 9.0% - 9.5% ] 9.35% | 55,888 | 0.52% |
[ 9.5% - 10.0% ] 9.78% | 55,686 | 2.0% |
[ 10.0% - 10.5% ] 10.32% | 58,066 | 0.75% |
[ 10.5% - 11.0% ] 10.66% | 98,562 | 0.81% |
[ 11.5% - 12.0% ] 11.97% | 50,453 | 0.35% |
[ 12.0% - 12.5% ] 12.02% | 47,627 | 0.38% |
[ 12.5% - 13.0% ] 12.64% | 39,873 | 0.35% |
[ 13.0% - 13.5% ] 13.23% | 90,509 | 3.0% |
[ 13.5% - 14.0% ] 13.78% | 5,921 | 1.5% |
[ 14.0% - 14.5% ] 14.07% | 71,266 | 0.60% |
[ 14.5% - 15.0% ] 14.59% | 22,701 | 2.0% |
[ 23.5% - 24.0% ] 23.91% | 4,555 | 4.7% |
[ 25.5% - 26.0% ] 25.52% | 3,593 | 5.3% |
[ 39.0% - 39.5% ] 39.37% | 10,042 | 2.1% |
[ 44.5% - 45.0% ] 44.73% | 65,116 | 1.8% |