Hawaiian 1 or more Vehicles in Household
COMPARE
Hawaiian
Select to Compare
1 or more Vehicles in Household
Hawaiian 1 or more Vehicles in Household
92.0%
1+ VEHICLES AVAILABLE
99.9/ 100
METRIC RATING
53rd/ 347
METRIC RANK
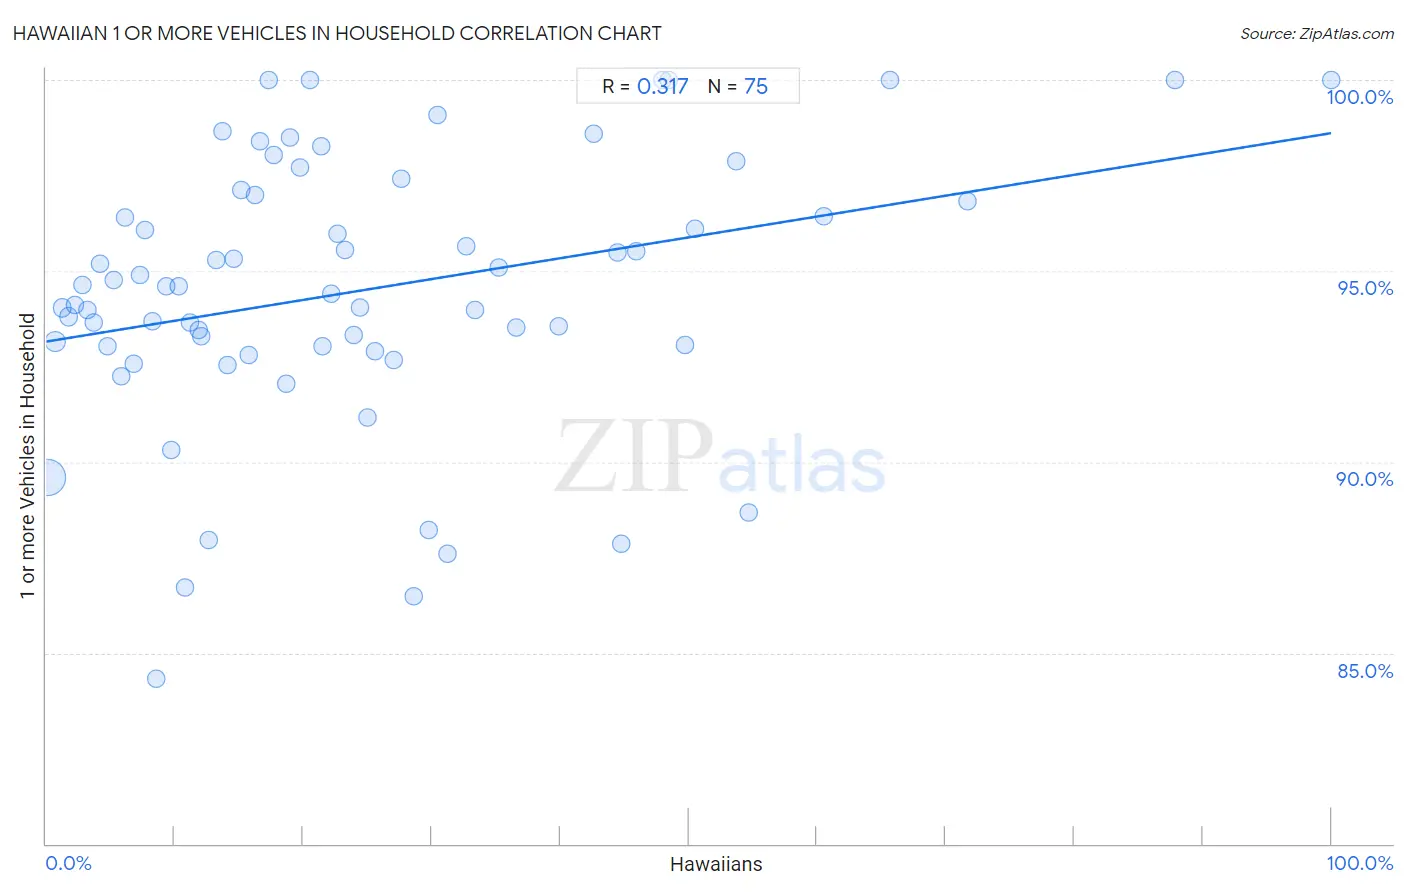
Hawaiian 1 or more Vehicles in Household Correlation Chart
The statistical analysis conducted on geographies consisting of 327,409,815 people shows a mild positive correlation between the proportion of Hawaiians and percentage of households with 1 or more vehicles available in the United States with a correlation coefficient (R) of 0.317 and weighted average of 92.0%. On average, for every 1% (one percent) increase in Hawaiians within a typical geography, there is an increase of 0.055% in percentage of households with 1 or more vehicles available.
It is essential to understand that the correlation between the percentage of Hawaiians and percentage of households with 1 or more vehicles available does not imply a direct cause-and-effect relationship. It remains uncertain whether the presence of Hawaiians influences an upward or downward trend in the level of percentage of households with 1 or more vehicles available within an area, or if Hawaiians simply ended up residing in those areas with higher or lower levels of percentage of households with 1 or more vehicles available due to other factors.
Demographics Similar to Hawaiians by 1 or more Vehicles in Household
In terms of 1 or more vehicles in household, the demographic groups most similar to Hawaiians are Slovene (92.0%, a difference of 0.010%), Korean (92.1%, a difference of 0.030%), Celtic (92.1%, a difference of 0.060%), Guamanian/Chamorro (92.1%, a difference of 0.070%), and Immigrants from Afghanistan (92.0%, a difference of 0.070%).
| Demographics | Rating | Rank | 1 or more Vehicles in Household |
| Immigrants from Fiji | 99.9 /100 | #46 | Exceptional 92.2% |
| Northern Europeans | 99.9 /100 | #47 | Exceptional 92.2% |
| Belgians | 99.9 /100 | #48 | Exceptional 92.1% |
| Afghans | 99.9 /100 | #49 | Exceptional 92.1% |
| Guamanians/Chamorros | 99.9 /100 | #50 | Exceptional 92.1% |
| Celtics | 99.9 /100 | #51 | Exceptional 92.1% |
| Koreans | 99.9 /100 | #52 | Exceptional 92.1% |
| Hawaiians | 99.9 /100 | #53 | Exceptional 92.0% |
| Slovenes | 99.9 /100 | #54 | Exceptional 92.0% |
| Immigrants from Afghanistan | 99.9 /100 | #55 | Exceptional 92.0% |
| Immigrants from Venezuela | 99.9 /100 | #56 | Exceptional 92.0% |
| Iraqis | 99.8 /100 | #57 | Exceptional 91.9% |
| Immigrants from Mexico | 99.8 /100 | #58 | Exceptional 91.9% |
| Venezuelans | 99.8 /100 | #59 | Exceptional 91.9% |
| Slovaks | 99.8 /100 | #60 | Exceptional 91.9% |
Hawaiian 1 or more Vehicles in Household Correlation Summary
| Measurement | Hawaiian Data | 1 or more Vehicles in Household Data |
| Minimum | 0.13% | 84.3% |
| Maximum | 100.0% | 100.0% |
| Range | 99.9% | 15.7% |
| Mean | 24.4% | 94.5% |
| Median | 19.0% | 94.6% |
| Interquartile 25% (IQ1) | 9.3% | 93.0% |
| Interquartile 75% (IQ3) | 33.3% | 97.0% |
| Interquartile Range (IQR) | 24.0% | 4.0% |
| Standard Deviation (Sample) | 20.6% | 3.5% |
| Standard Deviation (Population) | 20.4% | 3.5% |
Correlation Details
| Hawaiian Percentile | Sample Size | 1 or more Vehicles in Household |
[ 0.0% - 0.5% ] 0.13% | 278,961,659 | 89.6% |
[ 0.5% - 1.0% ] 0.71% | 27,946,599 | 93.2% |
[ 1.0% - 1.5% ] 1.22% | 8,156,123 | 94.0% |
[ 1.5% - 2.0% ] 1.73% | 4,619,773 | 93.8% |
[ 2.0% - 2.5% ] 2.23% | 1,393,024 | 94.1% |
[ 2.5% - 3.0% ] 2.78% | 1,260,234 | 94.6% |
[ 3.0% - 3.5% ] 3.22% | 885,596 | 94.0% |
[ 3.5% - 4.0% ] 3.73% | 533,370 | 93.6% |
[ 4.0% - 4.5% ] 4.20% | 490,686 | 95.2% |
[ 4.5% - 5.0% ] 4.73% | 352,959 | 93.0% |
[ 5.0% - 5.5% ] 5.27% | 215,602 | 94.8% |
[ 5.5% - 6.0% ] 5.85% | 72,931 | 92.2% |
[ 6.0% - 6.5% ] 6.13% | 113,178 | 96.4% |
[ 6.5% - 7.0% ] 6.78% | 161,917 | 92.6% |
[ 7.0% - 7.5% ] 7.31% | 339,406 | 94.9% |
[ 7.5% - 8.0% ] 7.65% | 124,958 | 96.1% |
[ 8.0% - 8.5% ] 8.24% | 93,802 | 93.7% |
[ 8.5% - 9.0% ] 8.53% | 377,701 | 84.3% |
[ 9.0% - 9.5% ] 9.33% | 136,085 | 94.6% |
[ 9.5% - 10.0% ] 9.77% | 130,838 | 90.3% |
[ 10.0% - 10.5% ] 10.29% | 91,274 | 94.6% |
[ 10.5% - 11.0% ] 10.78% | 181,442 | 86.7% |
[ 11.0% - 11.5% ] 11.16% | 17,109 | 93.7% |
[ 11.5% - 12.0% ] 11.83% | 78,234 | 93.5% |
[ 12.0% - 12.5% ] 12.07% | 66,527 | 93.3% |
[ 12.5% - 13.0% ] 12.64% | 41,868 | 88.0% |
[ 13.0% - 13.5% ] 13.23% | 95,035 | 95.3% |
[ 13.5% - 14.0% ] 13.73% | 25,587 | 98.7% |
[ 14.0% - 14.5% ] 14.14% | 124,786 | 92.5% |
[ 14.5% - 15.0% ] 14.64% | 70,957 | 95.3% |
[ 15.0% - 15.5% ] 15.15% | 3,656 | 97.1% |
[ 15.5% - 16.0% ] 15.77% | 17,642 | 92.8% |
[ 16.0% - 16.5% ] 16.21% | 7,809 | 97.0% |
[ 16.5% - 17.0% ] 16.63% | 6,868 | 98.4% |
[ 17.0% - 17.5% ] 17.34% | 1,528 | 100.0% |
[ 17.5% - 18.0% ] 17.69% | 1,984 | 98.0% |
[ 18.5% - 19.0% ] 18.66% | 9,185 | 92.0% |
[ 19.0% - 19.5% ] 19.00% | 2,489 | 98.5% |
[ 19.5% - 20.0% ] 19.70% | 7,974 | 97.7% |
[ 20.5% - 21.0% ] 20.51% | 156 | 100.0% |
[ 21.0% - 21.5% ] 21.39% | 2,211 | 98.3% |
[ 21.5% - 22.0% ] 21.52% | 3,322 | 93.0% |
[ 22.0% - 22.5% ] 22.19% | 6,626 | 94.4% |
[ 22.5% - 23.0% ] 22.66% | 11,406 | 96.0% |
[ 23.0% - 23.5% ] 23.27% | 2,742 | 95.6% |
[ 23.5% - 24.0% ] 23.91% | 4,555 | 93.3% |
[ 24.0% - 24.5% ] 24.41% | 254 | 94.0% |
[ 25.0% - 25.5% ] 25.04% | 1,278 | 91.2% |
[ 25.5% - 26.0% ] 25.61% | 5,267 | 92.9% |
[ 27.0% - 27.5% ] 27.03% | 1,798 | 92.7% |
[ 27.5% - 28.0% ] 27.65% | 8,710 | 97.4% |
[ 28.5% - 29.0% ] 28.59% | 1,462 | 86.5% |
[ 29.5% - 30.0% ] 29.77% | 6,694 | 88.2% |
[ 30.0% - 30.5% ] 30.47% | 2,872 | 99.1% |
[ 31.0% - 31.5% ] 31.25% | 5,891 | 87.6% |
[ 32.5% - 33.0% ] 32.69% | 10,307 | 95.7% |
[ 33.0% - 33.5% ] 33.33% | 465 | 94.0% |
[ 35.0% - 35.5% ] 35.24% | 4,827 | 95.1% |
[ 36.5% - 37.0% ] 36.58% | 4,284 | 93.5% |
[ 39.5% - 40.0% ] 39.87% | 4,475 | 93.5% |
[ 42.5% - 43.0% ] 42.64% | 12,114 | 98.6% |
[ 44.0% - 44.5% ] 44.46% | 902 | 95.5% |
[ 44.5% - 45.0% ] 44.73% | 65,116 | 87.8% |
[ 45.5% - 46.0% ] 45.93% | 3,412 | 95.5% |
[ 47.5% - 48.0% ] 47.99% | 398 | 100.0% |
[ 48.0% - 48.5% ] 48.46% | 130 | 100.0% |
[ 49.5% - 50.0% ] 49.74% | 380 | 93.1% |
[ 50.0% - 50.5% ] 50.47% | 2,853 | 96.1% |
[ 53.5% - 54.0% ] 53.69% | 2,157 | 97.9% |
[ 54.5% - 55.0% ] 54.63% | 12,370 | 88.7% |
[ 60.0% - 60.5% ] 60.49% | 324 | 96.4% |
[ 65.5% - 66.0% ] 65.66% | 99 | 100.0% |
[ 71.5% - 72.0% ] 71.73% | 1,436 | 96.8% |
[ 87.5% - 88.0% ] 87.84% | 74 | 100.0% |
[ 99.5% - 100.0% ] 100.00% | 53 | 100.0% |