Hawaiian Female Disability
COMPARE
Hawaiian
Select to Compare
Female Disability
Hawaiian Female Disability
12.7%
DISABILITY | FEMALES
1.4/ 100
METRIC RATING
254th/ 347
METRIC RANK
Hawaiian Female Disability Correlation Chart
The statistical analysis conducted on geographies consisting of 327,480,697 people shows a poor positive correlation between the proportion of Hawaiians and percentage of females with a disability in the United States with a correlation coefficient (R) of 0.145 and weighted average of 12.7%. On average, for every 1% (one percent) increase in Hawaiians within a typical geography, there is an increase of 0.037% in percentage of females with a disability.
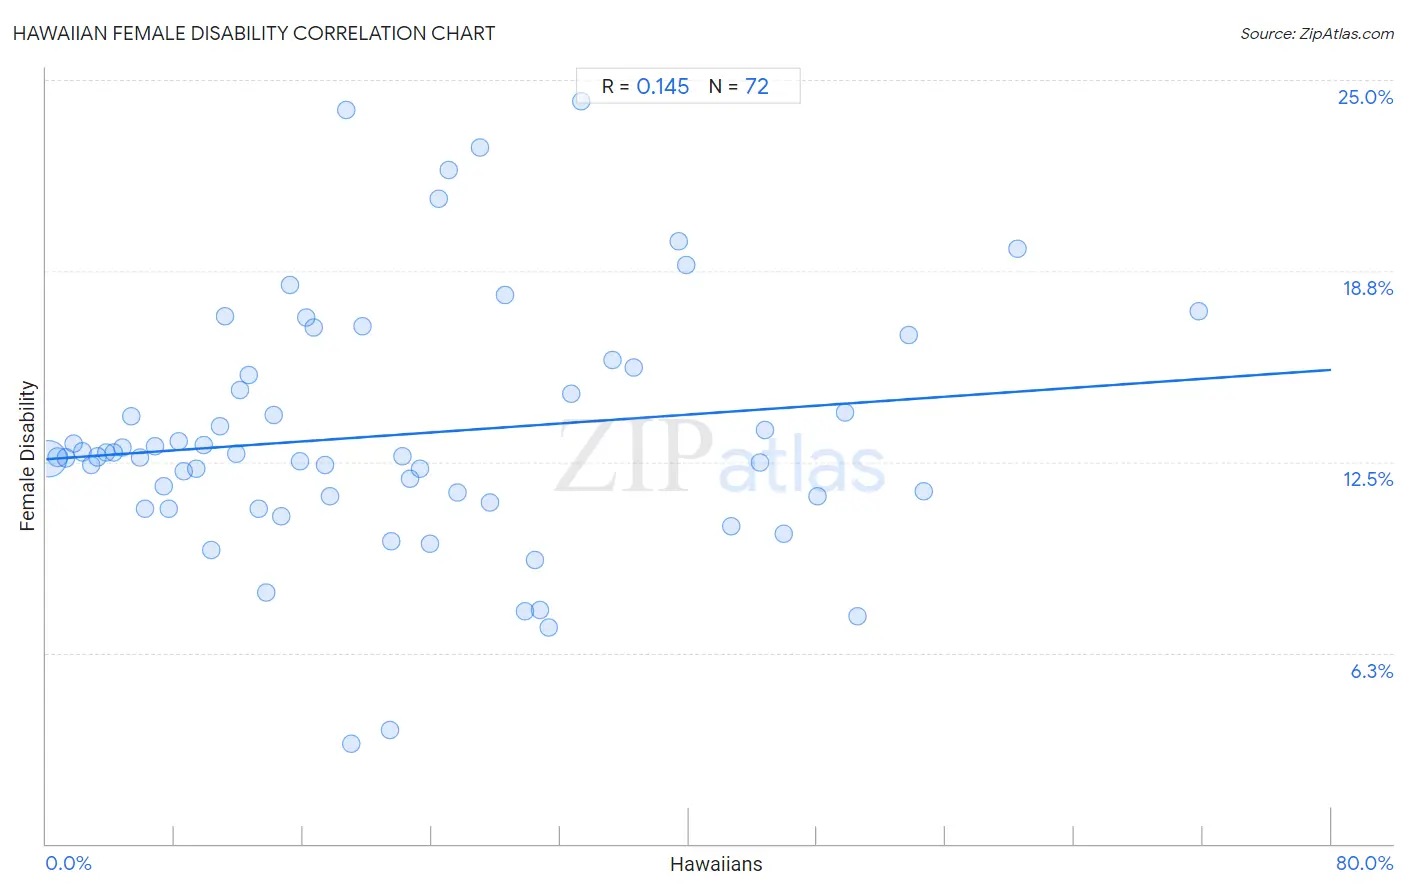
It is essential to understand that the correlation between the percentage of Hawaiians and percentage of females with a disability does not imply a direct cause-and-effect relationship. It remains uncertain whether the presence of Hawaiians influences an upward or downward trend in the level of percentage of females with a disability within an area, or if Hawaiians simply ended up residing in those areas with higher or lower levels of percentage of females with a disability due to other factors.
Demographics Similar to Hawaiians by Female Disability
In terms of female disability, the demographic groups most similar to Hawaiians are Jamaican (12.7%, a difference of 0.030%), Immigrants from Caribbean (12.7%, a difference of 0.040%), Immigrants from Germany (12.7%, a difference of 0.080%), Crow (12.7%, a difference of 0.12%), and British West Indian (12.7%, a difference of 0.15%).
| Demographics | Rating | Rank | Female Disability |
| Menominee | 2.1 /100 | #247 | Tragic 12.6% |
| Carpatho Rusyns | 2.0 /100 | #248 | Tragic 12.6% |
| Immigrants from Congo | 1.8 /100 | #249 | Tragic 12.7% |
| Slovenes | 1.7 /100 | #250 | Tragic 12.7% |
| Crow | 1.6 /100 | #251 | Tragic 12.7% |
| Immigrants from Caribbean | 1.4 /100 | #252 | Tragic 12.7% |
| Jamaicans | 1.4 /100 | #253 | Tragic 12.7% |
| Hawaiians | 1.4 /100 | #254 | Tragic 12.7% |
| Immigrants from Germany | 1.3 /100 | #255 | Tragic 12.7% |
| British West Indians | 1.2 /100 | #256 | Tragic 12.7% |
| Liberians | 1.1 /100 | #257 | Tragic 12.7% |
| Aleuts | 1.1 /100 | #258 | Tragic 12.7% |
| Immigrants from Armenia | 1.0 /100 | #259 | Tragic 12.7% |
| Sub-Saharan Africans | 1.0 /100 | #260 | Tragic 12.7% |
| Bermudans | 1.0 /100 | #261 | Tragic 12.7% |
Hawaiian Female Disability Correlation Summary
| Measurement | Hawaiian Data | Female Disability Data |
| Minimum | 0.13% | 3.3% |
| Maximum | 71.7% | 24.3% |
| Range | 71.6% | 21.1% |
| Mean | 21.9% | 13.4% |
| Median | 18.2% | 12.7% |
| Interquartile 25% (IQ1) | 8.9% | 11.3% |
| Interquartile 75% (IQ3) | 31.0% | 15.5% |
| Interquartile Range (IQR) | 22.1% | 4.2% |
| Standard Deviation (Sample) | 16.4% | 4.1% |
| Standard Deviation (Population) | 16.3% | 4.1% |
Correlation Details
| Hawaiian Percentile | Sample Size | Female Disability |
[ 0.0% - 0.5% ] 0.13% | 279,024,613 | 12.6% |
[ 0.5% - 1.0% ] 0.71% | 27,939,597 | 12.6% |
[ 1.0% - 1.5% ] 1.22% | 8,156,784 | 12.6% |
[ 1.5% - 2.0% ] 1.73% | 4,621,479 | 13.1% |
[ 2.0% - 2.5% ] 2.23% | 1,394,433 | 12.8% |
[ 2.5% - 3.0% ] 2.78% | 1,260,200 | 12.4% |
[ 3.0% - 3.5% ] 3.22% | 886,363 | 12.7% |
[ 3.5% - 4.0% ] 3.73% | 533,370 | 12.8% |
[ 4.0% - 4.5% ] 4.20% | 490,327 | 12.8% |
[ 4.5% - 5.0% ] 4.73% | 352,875 | 13.0% |
[ 5.0% - 5.5% ] 5.27% | 214,980 | 14.0% |
[ 5.5% - 6.0% ] 5.85% | 72,394 | 12.6% |
[ 6.0% - 6.5% ] 6.13% | 113,147 | 11.0% |
[ 6.5% - 7.0% ] 6.78% | 161,917 | 13.0% |
[ 7.0% - 7.5% ] 7.31% | 338,790 | 11.7% |
[ 7.5% - 8.0% ] 7.65% | 124,958 | 11.0% |
[ 8.0% - 8.5% ] 8.24% | 93,802 | 13.2% |
[ 8.5% - 9.0% ] 8.53% | 377,701 | 12.2% |
[ 9.0% - 9.5% ] 9.33% | 136,552 | 12.3% |
[ 9.5% - 10.0% ] 9.77% | 130,838 | 13.0% |
[ 10.0% - 10.5% ] 10.29% | 91,303 | 9.6% |
[ 10.5% - 11.0% ] 10.78% | 181,442 | 13.7% |
[ 11.0% - 11.5% ] 11.16% | 17,109 | 17.2% |
[ 11.5% - 12.0% ] 11.83% | 78,234 | 12.8% |
[ 12.0% - 12.5% ] 12.07% | 66,527 | 14.9% |
[ 12.5% - 13.0% ] 12.64% | 41,868 | 15.3% |
[ 13.0% - 13.5% ] 13.23% | 95,035 | 11.0% |
[ 13.5% - 14.0% ] 13.73% | 25,506 | 8.2% |
[ 14.0% - 14.5% ] 14.14% | 124,786 | 14.0% |
[ 14.5% - 15.0% ] 14.64% | 70,850 | 10.7% |
[ 15.0% - 15.5% ] 15.15% | 3,656 | 18.3% |
[ 15.5% - 16.0% ] 15.77% | 17,604 | 12.5% |
[ 16.0% - 16.5% ] 16.21% | 7,809 | 17.2% |
[ 16.5% - 17.0% ] 16.63% | 6,868 | 16.9% |
[ 17.0% - 17.5% ] 17.34% | 1,528 | 12.4% |
[ 17.5% - 18.0% ] 17.69% | 1,984 | 11.4% |
[ 18.5% - 19.0% ] 18.66% | 9,185 | 24.0% |
[ 19.0% - 19.5% ] 19.00% | 2,489 | 3.3% |
[ 19.5% - 20.0% ] 19.70% | 7,974 | 16.9% |
[ 21.0% - 21.5% ] 21.39% | 2,211 | 3.7% |
[ 21.5% - 22.0% ] 21.52% | 3,221 | 9.9% |
[ 22.0% - 22.5% ] 22.19% | 6,626 | 12.7% |
[ 22.5% - 23.0% ] 22.66% | 11,406 | 11.9% |
[ 23.0% - 23.5% ] 23.27% | 2,742 | 12.3% |
[ 23.5% - 24.0% ] 23.91% | 4,555 | 9.8% |
[ 24.0% - 24.5% ] 24.41% | 254 | 21.1% |
[ 25.0% - 25.5% ] 25.04% | 1,278 | 22.1% |
[ 25.5% - 26.0% ] 25.61% | 5,267 | 11.5% |
[ 27.0% - 27.5% ] 27.03% | 1,798 | 22.8% |
[ 27.5% - 28.0% ] 27.65% | 8,710 | 11.2% |
[ 28.5% - 29.0% ] 28.59% | 1,462 | 18.0% |
[ 29.5% - 30.0% ] 29.77% | 6,694 | 7.6% |
[ 30.0% - 30.5% ] 30.47% | 2,872 | 9.3% |
[ 30.5% - 31.0% ] 30.76% | 2,971 | 7.7% |
[ 31.0% - 31.5% ] 31.25% | 5,891 | 7.1% |
[ 32.5% - 33.0% ] 32.69% | 10,307 | 14.7% |
[ 33.0% - 33.5% ] 33.33% | 465 | 24.3% |
[ 35.0% - 35.5% ] 35.24% | 4,827 | 15.8% |
[ 36.5% - 37.0% ] 36.58% | 4,284 | 15.6% |
[ 39.0% - 39.5% ] 39.37% | 10,042 | 19.7% |
[ 39.5% - 40.0% ] 39.87% | 4,475 | 18.9% |
[ 42.5% - 43.0% ] 42.64% | 12,114 | 10.4% |
[ 44.0% - 44.5% ] 44.46% | 902 | 12.5% |
[ 44.5% - 45.0% ] 44.73% | 65,116 | 13.5% |
[ 45.5% - 46.0% ] 45.93% | 3,412 | 10.1% |
[ 47.5% - 48.0% ] 47.99% | 398 | 11.4% |
[ 49.5% - 50.0% ] 49.74% | 380 | 14.1% |
[ 50.0% - 50.5% ] 50.47% | 2,853 | 7.4% |
[ 53.5% - 54.0% ] 53.69% | 2,157 | 16.6% |
[ 54.5% - 55.0% ] 54.63% | 12,370 | 11.5% |
[ 60.0% - 60.5% ] 60.49% | 324 | 19.5% |
[ 71.5% - 72.0% ] 71.73% | 1,436 | 17.4% |