Hawaiian College, 1 year or more
COMPARE
Hawaiian
Select to Compare
College, 1 year or more
Hawaiian College, 1 year or more
55.6%
COLLEGE, 1 YEAR OR MORE
0.8/ 100
METRIC RATING
247th/ 347
METRIC RANK
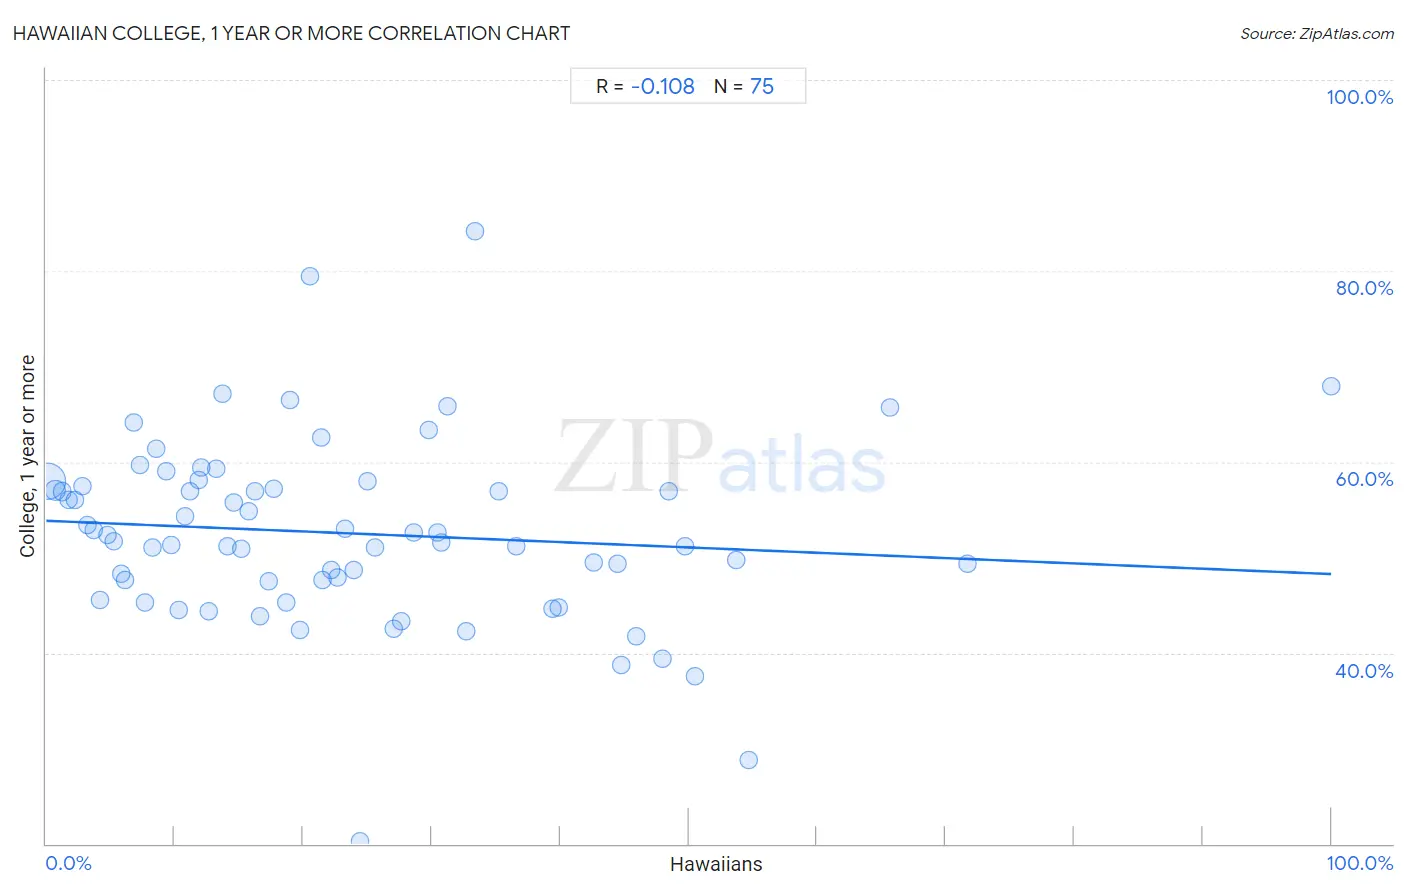
Hawaiian College, 1 year or more Correlation Chart
The statistical analysis conducted on geographies consisting of 327,619,549 people shows a poor negative correlation between the proportion of Hawaiians and percentage of population with at least college, 1 year or more education in the United States with a correlation coefficient (R) of -0.108 and weighted average of 55.6%. On average, for every 1% (one percent) increase in Hawaiians within a typical geography, there is a decrease of 0.056% in percentage of population with at least college, 1 year or more education.
It is essential to understand that the correlation between the percentage of Hawaiians and percentage of population with at least college, 1 year or more education does not imply a direct cause-and-effect relationship. It remains uncertain whether the presence of Hawaiians influences an upward or downward trend in the level of percentage of population with at least college, 1 year or more education within an area, or if Hawaiians simply ended up residing in those areas with higher or lower levels of percentage of population with at least college, 1 year or more education due to other factors.
Demographics Similar to Hawaiians by College, 1 year or more
In terms of college, 1 year or more, the demographic groups most similar to Hawaiians are Immigrants from Congo (55.6%, a difference of 0.040%), Malaysian (55.6%, a difference of 0.070%), Immigrants from Liberia (55.7%, a difference of 0.12%), Immigrants from Trinidad and Tobago (55.5%, a difference of 0.13%), and Delaware (55.5%, a difference of 0.16%).
| Demographics | Rating | Rank | College, 1 year or more |
| Trinidadians and Tobagonians | 1.1 /100 | #240 | Tragic 55.8% |
| French American Indians | 1.0 /100 | #241 | Tragic 55.8% |
| Marshallese | 1.0 /100 | #242 | Tragic 55.8% |
| Osage | 1.0 /100 | #243 | Tragic 55.8% |
| Chippewa | 0.9 /100 | #244 | Tragic 55.7% |
| Immigrants from Liberia | 0.8 /100 | #245 | Tragic 55.7% |
| Malaysians | 0.8 /100 | #246 | Tragic 55.6% |
| Hawaiians | 0.8 /100 | #247 | Tragic 55.6% |
| Immigrants from Congo | 0.8 /100 | #248 | Tragic 55.6% |
| Immigrants from Trinidad and Tobago | 0.7 /100 | #249 | Tragic 55.5% |
| Delaware | 0.7 /100 | #250 | Tragic 55.5% |
| Immigrants from Cambodia | 0.6 /100 | #251 | Tragic 55.4% |
| Aleuts | 0.6 /100 | #252 | Tragic 55.4% |
| Immigrants from Barbados | 0.6 /100 | #253 | Tragic 55.4% |
| Japanese | 0.5 /100 | #254 | Tragic 55.2% |
Hawaiian College, 1 year or more Correlation Summary
| Measurement | Hawaiian Data | College, 1 year or more Data |
| Minimum | 0.13% | 20.3% |
| Maximum | 100.0% | 84.1% |
| Range | 99.9% | 63.8% |
| Mean | 23.4% | 52.5% |
| Median | 19.0% | 51.7% |
| Interquartile 25% (IQ1) | 9.3% | 47.5% |
| Interquartile 75% (IQ3) | 32.7% | 57.4% |
| Interquartile Range (IQR) | 23.4% | 9.9% |
| Standard Deviation (Sample) | 18.8% | 9.7% |
| Standard Deviation (Population) | 18.7% | 9.7% |
Correlation Details
| Hawaiian Percentile | Sample Size | College, 1 year or more |
[ 0.0% - 0.5% ] 0.13% | 279,070,074 | 58.0% |
[ 0.5% - 1.0% ] 0.71% | 27,970,763 | 57.0% |
[ 1.0% - 1.5% ] 1.22% | 8,188,417 | 56.9% |
[ 1.5% - 2.0% ] 1.73% | 4,640,319 | 56.0% |
[ 2.0% - 2.5% ] 2.23% | 1,398,061 | 56.1% |
[ 2.5% - 3.0% ] 2.78% | 1,261,041 | 57.4% |
[ 3.0% - 3.5% ] 3.22% | 887,395 | 53.4% |
[ 3.5% - 4.0% ] 3.73% | 536,018 | 52.8% |
[ 4.0% - 4.5% ] 4.19% | 491,133 | 45.5% |
[ 4.5% - 5.0% ] 4.73% | 352,959 | 52.3% |
[ 5.0% - 5.5% ] 5.27% | 215,602 | 51.7% |
[ 5.5% - 6.0% ] 5.85% | 73,090 | 48.3% |
[ 6.0% - 6.5% ] 6.13% | 113,178 | 47.6% |
[ 6.5% - 7.0% ] 6.78% | 161,917 | 64.1% |
[ 7.0% - 7.5% ] 7.31% | 339,648 | 59.6% |
[ 7.5% - 8.0% ] 7.65% | 124,958 | 45.2% |
[ 8.0% - 8.5% ] 8.24% | 93,972 | 51.0% |
[ 8.5% - 9.0% ] 8.53% | 377,701 | 61.4% |
[ 9.0% - 9.5% ] 9.33% | 136,552 | 59.0% |
[ 9.5% - 10.0% ] 9.77% | 130,838 | 51.3% |
[ 10.0% - 10.5% ] 10.29% | 91,303 | 44.5% |
[ 10.5% - 11.0% ] 10.78% | 181,442 | 54.3% |
[ 11.0% - 11.5% ] 11.16% | 17,109 | 57.0% |
[ 11.5% - 12.0% ] 11.83% | 78,234 | 58.1% |
[ 12.0% - 12.5% ] 12.07% | 66,347 | 59.5% |
[ 12.5% - 13.0% ] 12.64% | 41,868 | 44.4% |
[ 13.0% - 13.5% ] 13.23% | 95,035 | 59.3% |
[ 13.5% - 14.0% ] 13.73% | 25,587 | 67.1% |
[ 14.0% - 14.5% ] 14.14% | 124,786 | 51.2% |
[ 14.5% - 15.0% ] 14.64% | 71,032 | 55.8% |
[ 15.0% - 15.5% ] 15.15% | 3,656 | 50.9% |
[ 15.5% - 16.0% ] 15.77% | 17,642 | 54.9% |
[ 16.0% - 16.5% ] 16.21% | 7,809 | 56.9% |
[ 16.5% - 17.0% ] 16.63% | 6,868 | 43.8% |
[ 17.0% - 17.5% ] 17.34% | 1,528 | 47.5% |
[ 17.5% - 18.0% ] 17.69% | 1,984 | 57.1% |
[ 18.5% - 19.0% ] 18.66% | 9,185 | 45.3% |
[ 19.0% - 19.5% ] 19.00% | 2,489 | 66.5% |
[ 19.5% - 20.0% ] 19.70% | 7,974 | 42.4% |
[ 20.5% - 21.0% ] 20.51% | 156 | 79.5% |
[ 21.0% - 21.5% ] 21.39% | 2,211 | 62.6% |
[ 21.5% - 22.0% ] 21.52% | 3,322 | 47.7% |
[ 22.0% - 22.5% ] 22.19% | 6,626 | 48.6% |
[ 22.5% - 23.0% ] 22.66% | 11,406 | 47.9% |
[ 23.0% - 23.5% ] 23.27% | 2,742 | 53.1% |
[ 23.5% - 24.0% ] 23.91% | 4,555 | 48.6% |
[ 24.0% - 24.5% ] 24.41% | 254 | 20.3% |
[ 25.0% - 25.5% ] 25.04% | 1,278 | 58.0% |
[ 25.5% - 26.0% ] 25.61% | 5,267 | 51.0% |
[ 27.0% - 27.5% ] 27.03% | 1,798 | 42.5% |
[ 27.5% - 28.0% ] 27.65% | 8,710 | 43.3% |
[ 28.5% - 29.0% ] 28.59% | 1,462 | 52.7% |
[ 29.5% - 30.0% ] 29.77% | 6,694 | 63.4% |
[ 30.0% - 30.5% ] 30.47% | 2,872 | 52.6% |
[ 30.5% - 31.0% ] 30.76% | 2,971 | 51.6% |
[ 31.0% - 31.5% ] 31.25% | 5,891 | 65.9% |
[ 32.5% - 33.0% ] 32.69% | 10,307 | 42.3% |
[ 33.0% - 33.5% ] 33.33% | 465 | 84.1% |
[ 35.0% - 35.5% ] 35.24% | 4,827 | 57.0% |
[ 36.5% - 37.0% ] 36.58% | 4,284 | 51.2% |
[ 39.0% - 39.5% ] 39.37% | 10,042 | 44.6% |
[ 39.5% - 40.0% ] 39.87% | 4,475 | 44.8% |
[ 42.5% - 43.0% ] 42.64% | 12,114 | 49.5% |
[ 44.0% - 44.5% ] 44.46% | 902 | 49.3% |
[ 44.5% - 45.0% ] 44.73% | 65,116 | 38.7% |
[ 45.5% - 46.0% ] 45.93% | 3,412 | 41.8% |
[ 47.5% - 48.0% ] 47.99% | 398 | 39.4% |
[ 48.0% - 48.5% ] 48.46% | 130 | 57.0% |
[ 49.5% - 50.0% ] 49.74% | 380 | 51.1% |
[ 50.0% - 50.5% ] 50.47% | 2,853 | 37.6% |
[ 53.5% - 54.0% ] 53.69% | 2,157 | 49.7% |
[ 54.5% - 55.0% ] 54.63% | 12,370 | 28.7% |
[ 65.5% - 66.0% ] 65.66% | 99 | 65.7% |
[ 71.5% - 72.0% ] 71.73% | 1,436 | 49.3% |
[ 99.5% - 100.0% ] 100.00% | 53 | 67.9% |