English Female Disability
COMPARE
English
Select to Compare
Female Disability
English Female Disability
13.1%
DISABILITY | FEMALES
0.0/ 100
METRIC RATING
283rd/ 347
METRIC RANK
English Female Disability Correlation Chart
The statistical analysis conducted on geographies consisting of 579,455,511 people shows a substantial positive correlation between the proportion of English and percentage of females with a disability in the United States with a correlation coefficient (R) of 0.548 and weighted average of 13.1%. On average, for every 1% (one percent) increase in English within a typical geography, there is an increase of 0.27% in percentage of females with a disability.
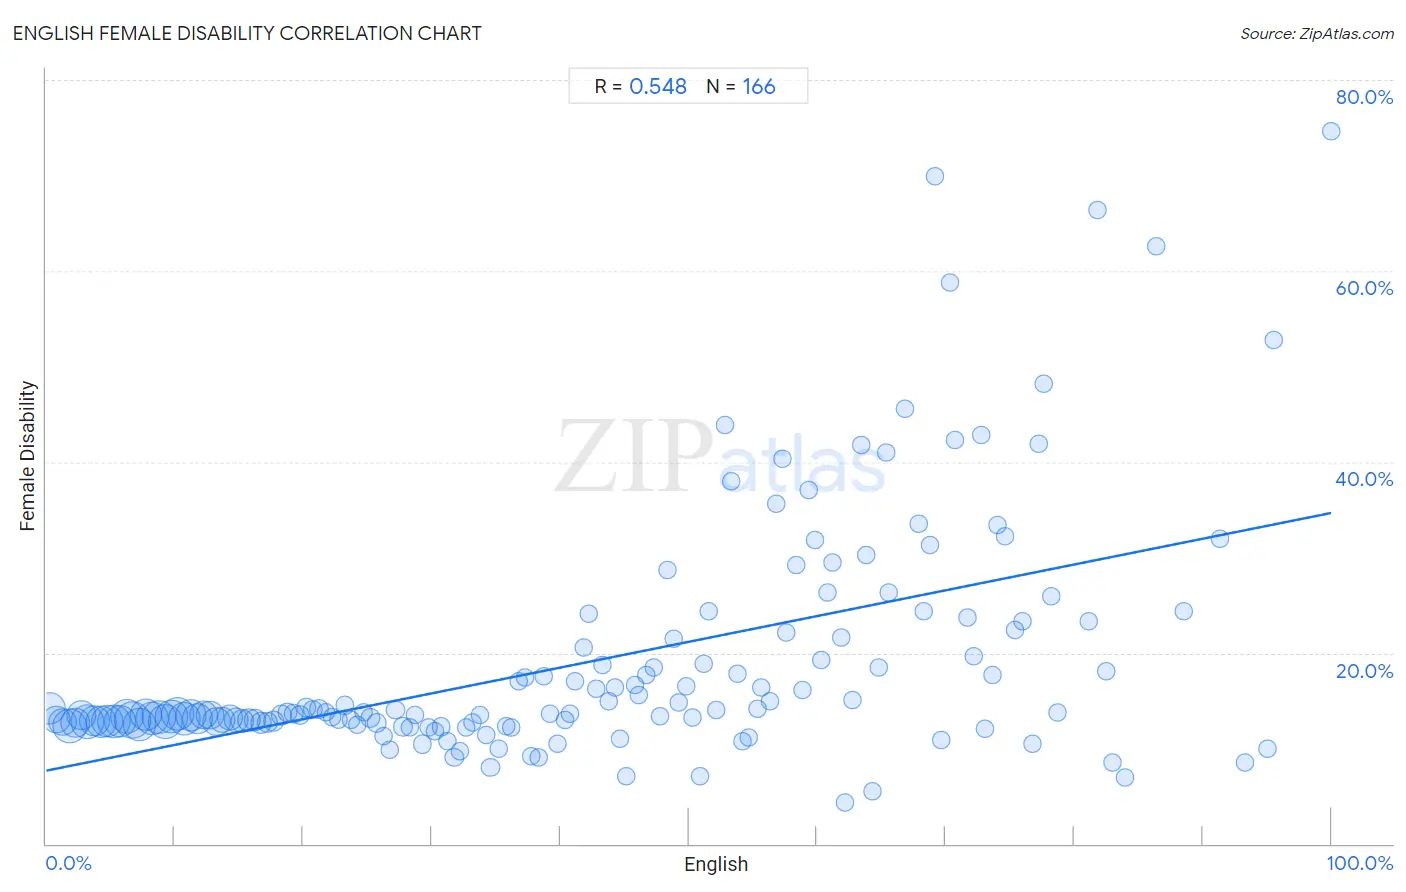
It is essential to understand that the correlation between the percentage of English and percentage of females with a disability does not imply a direct cause-and-effect relationship. It remains uncertain whether the presence of English influences an upward or downward trend in the level of percentage of females with a disability within an area, or if English simply ended up residing in those areas with higher or lower levels of percentage of females with a disability due to other factors.
Demographics Similar to English by Female Disability
In terms of female disability, the demographic groups most similar to English are Welsh (13.1%, a difference of 0.0%), U.S. Virgin Islander (13.1%, a difference of 0.080%), Irish (13.1%, a difference of 0.12%), Hmong (13.1%, a difference of 0.13%), and Bangladeshi (13.1%, a difference of 0.18%).
| Demographics | Rating | Rank | Female Disability |
| Immigrants from Dominica | 0.1 /100 | #276 | Tragic 13.0% |
| Spanish | 0.1 /100 | #277 | Tragic 13.0% |
| Scottish | 0.1 /100 | #278 | Tragic 13.0% |
| Arapaho | 0.1 /100 | #279 | Tragic 13.0% |
| Irish | 0.1 /100 | #280 | Tragic 13.1% |
| U.S. Virgin Islanders | 0.1 /100 | #281 | Tragic 13.1% |
| Welsh | 0.0 /100 | #282 | Tragic 13.1% |
| English | 0.0 /100 | #283 | Tragic 13.1% |
| Hmong | 0.0 /100 | #284 | Tragic 13.1% |
| Bangladeshis | 0.0 /100 | #285 | Tragic 13.1% |
| Fijians | 0.0 /100 | #286 | Tragic 13.1% |
| Yaqui | 0.0 /100 | #287 | Tragic 13.2% |
| Whites/Caucasians | 0.0 /100 | #288 | Tragic 13.2% |
| Tlingit-Haida | 0.0 /100 | #289 | Tragic 13.2% |
| Immigrants from Yemen | 0.0 /100 | #290 | Tragic 13.2% |
English Female Disability Correlation Summary
| Measurement | English Data | Female Disability Data |
| Minimum | 0.25% | 4.3% |
| Maximum | 100.0% | 74.6% |
| Range | 99.8% | 70.3% |
| Mean | 42.3% | 19.1% |
| Median | 41.5% | 13.6% |
| Interquartile 25% (IQ1) | 20.7% | 12.7% |
| Interquartile 75% (IQ3) | 62.1% | 21.5% |
| Interquartile Range (IQR) | 41.4% | 8.8% |
| Standard Deviation (Sample) | 25.4% | 12.5% |
| Standard Deviation (Population) | 25.3% | 12.5% |
Correlation Details
| English Percentile | Sample Size | Female Disability |
[ 0.0% - 0.5% ] 0.25% | 19,664,687 | 14.2% |
[ 0.5% - 1.0% ] 0.76% | 13,130,523 | 13.0% |
[ 1.0% - 1.5% ] 1.24% | 13,119,855 | 12.7% |
[ 1.5% - 2.0% ] 1.81% | 22,708,821 | 12.3% |
[ 2.0% - 2.5% ] 2.25% | 14,508,214 | 12.7% |
[ 2.5% - 3.0% ] 2.77% | 14,750,474 | 13.4% |
[ 3.0% - 3.5% ] 3.23% | 20,582,018 | 12.8% |
[ 3.5% - 4.0% ] 3.75% | 17,983,197 | 12.9% |
[ 4.0% - 4.5% ] 4.25% | 17,017,761 | 12.8% |
[ 4.5% - 5.0% ] 4.72% | 19,048,312 | 12.8% |
[ 5.0% - 5.5% ] 5.25% | 19,681,347 | 12.8% |
[ 5.5% - 6.0% ] 5.75% | 18,521,183 | 12.9% |
[ 6.0% - 6.5% ] 6.28% | 21,772,927 | 13.3% |
[ 6.5% - 7.0% ] 6.75% | 25,270,122 | 12.9% |
[ 7.0% - 7.5% ] 7.26% | 21,532,281 | 12.5% |
[ 7.5% - 8.0% ] 7.74% | 19,405,394 | 13.5% |
[ 8.0% - 8.5% ] 8.25% | 21,239,685 | 13.1% |
[ 8.5% - 9.0% ] 8.74% | 21,413,193 | 13.3% |
[ 9.0% - 9.5% ] 9.26% | 21,076,155 | 12.8% |
[ 9.5% - 10.0% ] 9.75% | 19,439,172 | 13.3% |
[ 10.0% - 10.5% ] 10.24% | 20,013,820 | 13.6% |
[ 10.5% - 11.0% ] 10.75% | 20,175,015 | 13.1% |
[ 11.0% - 11.5% ] 11.24% | 17,829,587 | 13.5% |
[ 11.5% - 12.0% ] 11.74% | 17,031,839 | 13.1% |
[ 12.0% - 12.5% ] 12.25% | 13,872,270 | 13.5% |
[ 12.5% - 13.0% ] 12.75% | 13,318,704 | 13.5% |
[ 13.0% - 13.5% ] 13.25% | 12,567,101 | 12.8% |
[ 13.5% - 14.0% ] 13.74% | 10,350,447 | 13.0% |
[ 14.0% - 14.5% ] 14.26% | 10,064,295 | 13.2% |
[ 14.5% - 15.0% ] 14.74% | 8,606,294 | 12.9% |
[ 15.0% - 15.5% ] 15.24% | 7,236,271 | 12.8% |
[ 15.5% - 16.0% ] 15.74% | 6,350,693 | 13.0% |
[ 16.0% - 16.5% ] 16.26% | 5,083,735 | 13.0% |
[ 16.5% - 17.0% ] 16.74% | 3,972,343 | 12.7% |
[ 17.0% - 17.5% ] 17.25% | 3,702,690 | 12.7% |
[ 17.5% - 18.0% ] 17.74% | 3,604,513 | 12.8% |
[ 18.0% - 18.5% ] 18.28% | 3,048,174 | 13.5% |
[ 18.5% - 19.0% ] 18.73% | 1,740,808 | 13.7% |
[ 19.0% - 19.5% ] 19.24% | 2,044,725 | 13.7% |
[ 19.5% - 20.0% ] 19.74% | 1,679,323 | 13.4% |
[ 20.0% - 20.5% ] 20.24% | 1,497,027 | 14.2% |
[ 20.5% - 21.0% ] 20.74% | 1,005,245 | 14.1% |
[ 21.0% - 21.5% ] 21.23% | 1,123,033 | 14.1% |
[ 21.5% - 22.0% ] 21.75% | 807,121 | 13.8% |
[ 22.0% - 22.5% ] 22.24% | 983,937 | 13.3% |
[ 22.5% - 23.0% ] 22.76% | 780,687 | 13.0% |
[ 23.0% - 23.5% ] 23.22% | 513,636 | 14.5% |
[ 23.5% - 24.0% ] 23.74% | 552,894 | 13.0% |
[ 24.0% - 24.5% ] 24.22% | 672,545 | 12.5% |
[ 24.5% - 25.0% ] 24.70% | 532,409 | 13.8% |
[ 25.0% - 25.5% ] 25.23% | 586,388 | 13.2% |
[ 25.5% - 26.0% ] 25.73% | 513,381 | 12.6% |
[ 26.0% - 26.5% ] 26.23% | 461,092 | 11.3% |
[ 26.5% - 27.0% ] 26.74% | 663,424 | 9.9% |
[ 27.0% - 27.5% ] 27.18% | 313,730 | 14.1% |
[ 27.5% - 28.0% ] 27.77% | 379,432 | 12.3% |
[ 28.0% - 28.5% ] 28.31% | 321,253 | 12.2% |
[ 28.5% - 29.0% ] 28.71% | 208,985 | 13.5% |
[ 29.0% - 29.5% ] 29.25% | 374,658 | 10.4% |
[ 29.5% - 30.0% ] 29.74% | 256,871 | 12.2% |
[ 30.0% - 30.5% ] 30.26% | 134,876 | 11.8% |
[ 30.5% - 31.0% ] 30.73% | 265,124 | 12.2% |
[ 31.0% - 31.5% ] 31.22% | 262,314 | 10.8% |
[ 31.5% - 32.0% ] 31.75% | 331,067 | 9.1% |
[ 32.0% - 32.5% ] 32.18% | 182,945 | 9.7% |
[ 32.5% - 33.0% ] 32.71% | 125,430 | 12.1% |
[ 33.0% - 33.5% ] 33.19% | 92,751 | 12.7% |
[ 33.5% - 34.0% ] 33.79% | 48,450 | 13.4% |
[ 34.0% - 34.5% ] 34.21% | 84,352 | 11.5% |
[ 34.5% - 35.0% ] 34.57% | 262,540 | 8.0% |
[ 35.0% - 35.5% ] 35.19% | 122,691 | 9.9% |
[ 35.5% - 36.0% ] 35.83% | 150,622 | 12.3% |
[ 36.0% - 36.5% ] 36.15% | 48,000 | 12.2% |
[ 36.5% - 37.0% ] 36.73% | 22,487 | 17.0% |
[ 37.0% - 37.5% ] 37.24% | 15,236 | 17.5% |
[ 37.5% - 38.0% ] 37.74% | 115,122 | 9.2% |
[ 38.0% - 38.5% ] 38.35% | 109,855 | 9.0% |
[ 38.5% - 39.0% ] 38.76% | 24,128 | 17.6% |
[ 39.0% - 39.5% ] 39.17% | 20,412 | 13.6% |
[ 39.5% - 40.0% ] 39.78% | 19,627 | 10.5% |
[ 40.0% - 40.5% ] 40.33% | 20,690 | 12.9% |
[ 40.5% - 41.0% ] 40.72% | 30,448 | 13.6% |
[ 41.0% - 41.5% ] 41.17% | 9,085 | 17.1% |
[ 41.5% - 42.0% ] 41.78% | 13,199 | 20.6% |
[ 42.0% - 42.5% ] 42.25% | 24,156 | 24.1% |
[ 42.5% - 43.0% ] 42.80% | 11,406 | 16.3% |
[ 43.0% - 43.5% ] 43.27% | 10,713 | 18.7% |
[ 43.5% - 44.0% ] 43.74% | 9,078 | 14.9% |
[ 44.0% - 44.5% ] 44.24% | 4,575 | 16.4% |
[ 44.5% - 45.0% ] 44.66% | 16,165 | 11.1% |
[ 45.0% - 45.5% ] 45.14% | 28,766 | 7.1% |
[ 45.5% - 46.0% ] 45.78% | 11,697 | 16.6% |
[ 46.0% - 46.5% ] 46.14% | 11,478 | 15.5% |
[ 46.5% - 47.0% ] 46.70% | 7,120 | 17.7% |
[ 47.0% - 47.5% ] 47.31% | 8,011 | 18.4% |
[ 47.5% - 48.0% ] 47.74% | 5,762 | 13.3% |
[ 48.0% - 48.5% ] 48.30% | 3,151 | 28.7% |
[ 48.5% - 49.0% ] 48.81% | 2,821 | 21.5% |
[ 49.0% - 49.5% ] 49.27% | 3,199 | 14.8% |
[ 49.5% - 50.0% ] 49.83% | 4,614 | 16.5% |
[ 50.0% - 50.5% ] 50.32% | 5,356 | 13.3% |
[ 50.5% - 51.0% ] 50.83% | 7,254 | 7.0% |
[ 51.0% - 51.5% ] 51.20% | 1,213 | 18.9% |
[ 51.5% - 52.0% ] 51.59% | 1,733 | 24.3% |
[ 52.0% - 52.5% ] 52.15% | 2,322 | 14.0% |
[ 52.5% - 53.0% ] 52.87% | 1,744 | 43.9% |
[ 53.0% - 53.5% ] 53.32% | 512 | 38.0% |
[ 53.5% - 54.0% ] 53.78% | 4,446 | 17.7% |
[ 54.0% - 54.5% ] 54.14% | 1,219 | 10.8% |
[ 54.5% - 55.0% ] 54.65% | 2,002 | 11.1% |
[ 55.0% - 55.5% ] 55.33% | 1,549 | 14.1% |
[ 55.5% - 56.0% ] 55.63% | 3,284 | 16.3% |
[ 56.0% - 56.5% ] 56.31% | 3,573 | 14.9% |
[ 56.5% - 57.0% ] 56.85% | 628 | 35.7% |
[ 57.0% - 57.5% ] 57.28% | 529 | 40.4% |
[ 57.5% - 58.0% ] 57.54% | 676 | 22.1% |
[ 58.0% - 58.5% ] 58.34% | 857 | 29.2% |
[ 58.5% - 59.0% ] 58.86% | 1,750 | 16.1% |
[ 59.0% - 59.5% ] 59.33% | 986 | 37.1% |
[ 59.5% - 60.0% ] 59.79% | 2,420 | 31.8% |
[ 60.0% - 60.5% ] 60.33% | 2,100 | 19.2% |
[ 60.5% - 61.0% ] 60.76% | 739 | 26.3% |
[ 61.0% - 61.5% ] 61.15% | 157 | 29.5% |
[ 61.5% - 62.0% ] 61.89% | 1,648 | 21.6% |
[ 62.0% - 62.5% ] 62.11% | 1,750 | 4.3% |
[ 62.5% - 63.0% ] 62.72% | 1,124 | 15.0% |
[ 63.0% - 63.5% ] 63.45% | 922 | 41.8% |
[ 63.5% - 64.0% ] 63.83% | 1,045 | 30.3% |
[ 64.0% - 64.5% ] 64.30% | 1,140 | 5.5% |
[ 64.5% - 65.0% ] 64.81% | 935 | 18.5% |
[ 65.0% - 65.5% ] 65.38% | 1,499 | 41.0% |
[ 65.5% - 66.0% ] 65.52% | 29 | 26.3% |
[ 66.5% - 67.0% ] 66.80% | 1,027 | 45.6% |
[ 67.5% - 68.0% ] 67.90% | 324 | 33.5% |
[ 68.0% - 68.5% ] 68.28% | 1,403 | 24.4% |
[ 68.5% - 69.0% ] 68.75% | 16 | 31.2% |
[ 69.0% - 69.5% ] 69.17% | 133 | 69.9% |
[ 69.5% - 70.0% ] 69.65% | 491 | 10.9% |
[ 70.0% - 70.5% ] 70.32% | 283 | 58.8% |
[ 70.5% - 71.0% ] 70.69% | 1,184 | 42.3% |
[ 71.5% - 72.0% ] 71.65% | 822 | 23.7% |
[ 72.0% - 72.5% ] 72.19% | 2,661 | 19.6% |
[ 72.5% - 73.0% ] 72.73% | 187 | 42.9% |
[ 73.0% - 73.5% ] 73.06% | 438 | 12.1% |
[ 73.5% - 74.0% ] 73.63% | 967 | 17.7% |
[ 74.0% - 74.5% ] 74.07% | 27 | 33.3% |
[ 74.5% - 75.0% ] 74.63% | 670 | 32.2% |
[ 75.0% - 75.5% ] 75.40% | 1,813 | 22.4% |
[ 75.5% - 76.0% ] 75.93% | 54 | 23.3% |
[ 76.5% - 77.0% ] 76.72% | 640 | 10.4% |
[ 77.0% - 77.5% ] 77.28% | 735 | 41.9% |
[ 77.5% - 78.0% ] 77.66% | 385 | 48.2% |
[ 78.0% - 78.5% ] 78.25% | 492 | 25.9% |
[ 78.5% - 79.0% ] 78.66% | 239 | 13.7% |
[ 81.0% - 81.5% ] 81.08% | 37 | 23.3% |
[ 81.5% - 82.0% ] 81.82% | 154 | 66.4% |
[ 82.0% - 82.5% ] 82.46% | 342 | 18.1% |
[ 82.5% - 83.0% ] 82.98% | 47 | 8.6% |
[ 83.5% - 84.0% ] 83.90% | 410 | 7.0% |
[ 86.0% - 86.5% ] 86.38% | 602 | 62.6% |
[ 88.5% - 89.0% ] 88.52% | 61 | 24.4% |
[ 91.0% - 91.5% ] 91.33% | 173 | 31.9% |
[ 93.0% - 93.5% ] 93.24% | 148 | 8.5% |
[ 95.0% - 95.5% ] 95.00% | 100 | 10.0% |
[ 95.5% - 96.0% ] 95.53% | 179 | 52.8% |
[ 99.5% - 100.0% ] 100.00% | 1,247 | 74.6% |