English Unemployment Among Women with Children Ages 6 to 17 years
COMPARE
English
Select to Compare
Unemployment Among Women with Children Ages 6 to 17 years
English Unemployment Among Women with Children Ages 6 to 17 years
9.4%
UNEMPLOYMENT | WOMEN W/ CHILDREN 6 TO 17
1.9/ 100
METRIC RATING
244th/ 347
METRIC RANK
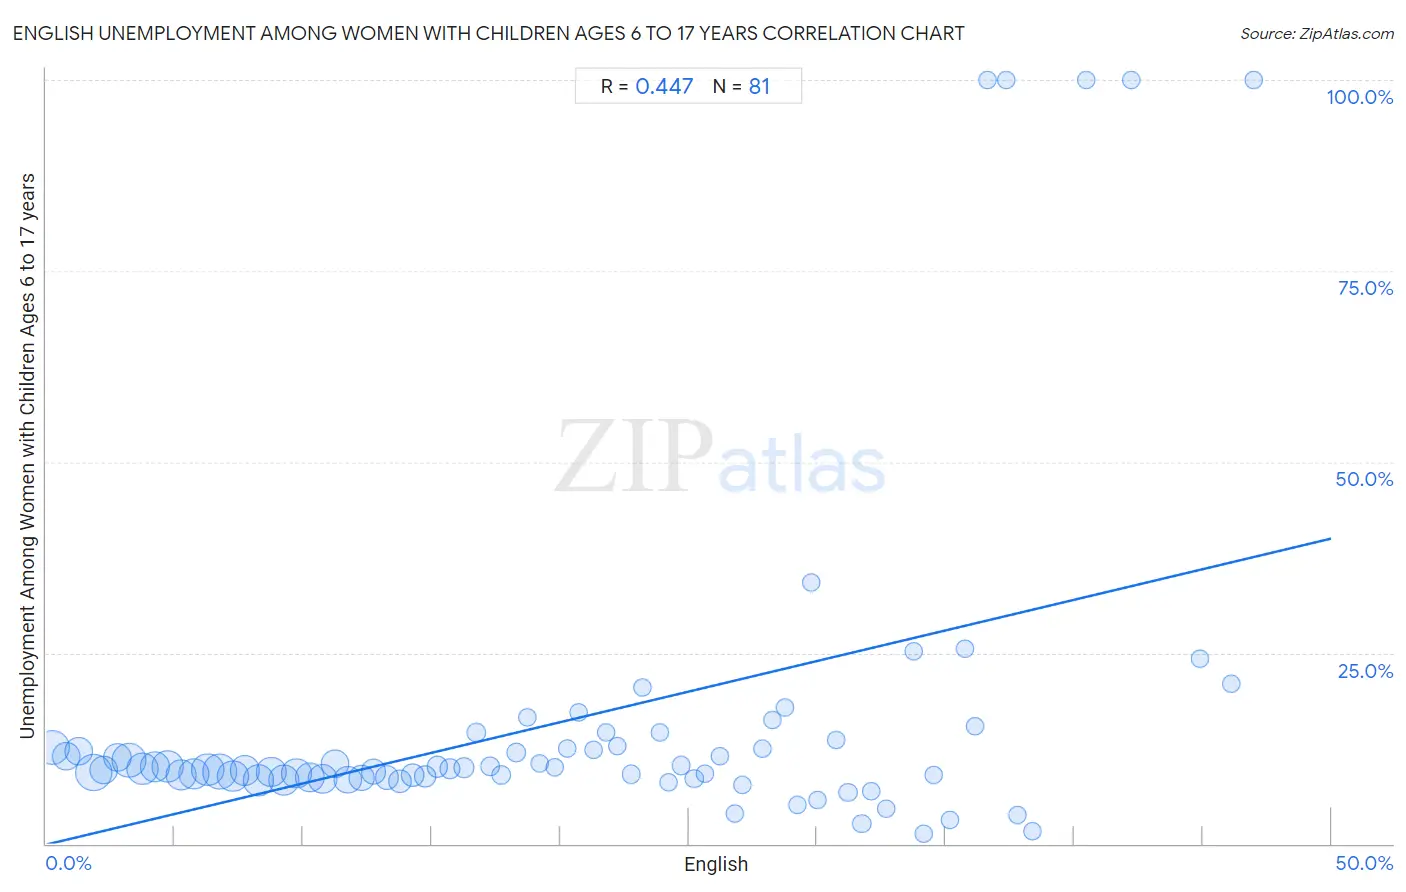
English Unemployment Among Women with Children Ages 6 to 17 years Correlation Chart
The statistical analysis conducted on geographies consisting of 358,817,794 people shows a moderate positive correlation between the proportion of English and unemployment rate among women with children between the ages 6 and 17 in the United States with a correlation coefficient (R) of 0.447 and weighted average of 9.4%. On average, for every 1% (one percent) increase in English within a typical geography, there is an increase of 0.80% in unemployment rate among women with children between the ages 6 and 17.
It is essential to understand that the correlation between the percentage of English and unemployment rate among women with children between the ages 6 and 17 does not imply a direct cause-and-effect relationship. It remains uncertain whether the presence of English influences an upward or downward trend in the level of unemployment rate among women with children between the ages 6 and 17 within an area, or if English simply ended up residing in those areas with higher or lower levels of unemployment rate among women with children between the ages 6 and 17 due to other factors.
Demographics Similar to English by Unemployment Among Women with Children Ages 6 to 17 years
In terms of unemployment among women with children ages 6 to 17 years, the demographic groups most similar to English are Immigrants from Cameroon (9.4%, a difference of 0.030%), Scottish (9.4%, a difference of 0.050%), Immigrants from Colombia (9.3%, a difference of 0.14%), Colombian (9.3%, a difference of 0.16%), and Immigrants from Africa (9.4%, a difference of 0.20%).
| Demographics | Rating | Rank | Unemployment Among Women with Children Ages 6 to 17 years |
| Immigrants from Belize | 2.8 /100 | #237 | Tragic 9.3% |
| Arabs | 2.7 /100 | #238 | Tragic 9.3% |
| Immigrants from Saudi Arabia | 2.7 /100 | #239 | Tragic 9.3% |
| Guatemalans | 2.3 /100 | #240 | Tragic 9.3% |
| Colombians | 2.2 /100 | #241 | Tragic 9.3% |
| Immigrants from Colombia | 2.1 /100 | #242 | Tragic 9.3% |
| Scottish | 2.0 /100 | #243 | Tragic 9.4% |
| English | 1.9 /100 | #244 | Tragic 9.4% |
| Immigrants from Cameroon | 1.8 /100 | #245 | Tragic 9.4% |
| Immigrants from Africa | 1.6 /100 | #246 | Tragic 9.4% |
| Poles | 1.5 /100 | #247 | Tragic 9.4% |
| Dutch | 1.5 /100 | #248 | Tragic 9.4% |
| Immigrants from South America | 1.5 /100 | #249 | Tragic 9.4% |
| Immigrants from Guatemala | 1.3 /100 | #250 | Tragic 9.4% |
| Central Americans | 1.3 /100 | #251 | Tragic 9.4% |
English Unemployment Among Women with Children Ages 6 to 17 years Correlation Summary
| Measurement | English Data | Unemployment Among Women with Children Ages 6 to 17 years Data |
| Minimum | 0.24% | 1.3% |
| Maximum | 47.0% | 100.0% |
| Range | 46.7% | 98.7% |
| Mean | 20.6% | 16.4% |
| Median | 20.3% | 9.8% |
| Interquartile 25% (IQ1) | 10.0% | 8.6% |
| Interquartile 75% (IQ3) | 30.4% | 13.2% |
| Interquartile Range (IQR) | 20.4% | 4.6% |
| Standard Deviation (Sample) | 12.4% | 22.2% |
| Standard Deviation (Population) | 12.3% | 22.1% |
Correlation Details
| English Percentile | Sample Size | Unemployment Among Women with Children Ages 6 to 17 years |
[ 0.0% - 0.5% ] 0.24% | 16,582,540 | 12.6% |
[ 0.5% - 1.0% ] 0.76% | 10,200,947 | 11.5% |
[ 1.0% - 1.5% ] 1.24% | 10,218,673 | 12.1% |
[ 1.5% - 2.0% ] 1.83% | 19,037,003 | 9.4% |
[ 2.0% - 2.5% ] 2.23% | 10,291,052 | 9.6% |
[ 2.5% - 3.0% ] 2.77% | 10,317,338 | 11.3% |
[ 3.0% - 3.5% ] 3.23% | 16,032,956 | 10.9% |
[ 3.5% - 4.0% ] 3.75% | 13,997,944 | 9.8% |
[ 4.0% - 4.5% ] 4.24% | 11,628,027 | 10.1% |
[ 4.5% - 5.0% ] 4.71% | 13,670,515 | 10.1% |
[ 5.0% - 5.5% ] 5.25% | 12,878,020 | 9.0% |
[ 5.5% - 6.0% ] 5.74% | 12,449,763 | 9.1% |
[ 6.0% - 6.5% ] 6.29% | 14,695,231 | 9.7% |
[ 6.5% - 7.0% ] 6.75% | 17,151,822 | 9.4% |
[ 7.0% - 7.5% ] 7.27% | 13,024,599 | 8.8% |
[ 7.5% - 8.0% ] 7.73% | 11,690,434 | 9.6% |
[ 8.0% - 8.5% ] 8.26% | 13,236,991 | 8.3% |
[ 8.5% - 9.0% ] 8.74% | 12,639,750 | 9.4% |
[ 9.0% - 9.5% ] 9.25% | 12,474,176 | 8.3% |
[ 9.5% - 10.0% ] 9.75% | 12,205,863 | 9.2% |
[ 10.0% - 10.5% ] 10.24% | 11,726,563 | 8.7% |
[ 10.5% - 11.0% ] 10.75% | 11,291,808 | 8.5% |
[ 11.0% - 11.5% ] 11.24% | 10,098,552 | 10.4% |
[ 11.5% - 12.0% ] 11.73% | 9,470,959 | 8.4% |
[ 12.0% - 12.5% ] 12.27% | 6,824,160 | 8.6% |
[ 12.5% - 13.0% ] 12.74% | 6,864,605 | 9.4% |
[ 13.0% - 13.5% ] 13.26% | 6,172,075 | 8.7% |
[ 13.5% - 14.0% ] 13.75% | 5,027,798 | 8.1% |
[ 14.0% - 14.5% ] 14.26% | 4,731,062 | 9.0% |
[ 14.5% - 15.0% ] 14.75% | 3,490,368 | 8.9% |
[ 15.0% - 15.5% ] 15.23% | 2,798,761 | 10.1% |
[ 15.5% - 16.0% ] 15.73% | 2,579,758 | 9.8% |
[ 16.0% - 16.5% ] 16.26% | 2,100,084 | 9.9% |
[ 16.5% - 17.0% ] 16.74% | 1,218,732 | 14.6% |
[ 17.0% - 17.5% ] 17.27% | 1,046,951 | 10.1% |
[ 17.5% - 18.0% ] 17.73% | 1,345,185 | 9.1% |
[ 18.0% - 18.5% ] 18.27% | 1,236,346 | 11.9% |
[ 18.5% - 19.0% ] 18.71% | 303,666 | 16.5% |
[ 19.0% - 19.5% ] 19.21% | 699,684 | 10.5% |
[ 19.5% - 20.0% ] 19.78% | 524,264 | 10.0% |
[ 20.0% - 20.5% ] 20.28% | 462,829 | 12.4% |
[ 20.5% - 21.0% ] 20.71% | 229,005 | 17.3% |
[ 21.0% - 21.5% ] 21.28% | 330,230 | 12.3% |
[ 21.5% - 22.0% ] 21.77% | 214,560 | 14.6% |
[ 22.0% - 22.5% ] 22.21% | 344,233 | 12.8% |
[ 22.5% - 23.0% ] 22.76% | 203,313 | 9.1% |
[ 23.0% - 23.5% ] 23.22% | 113,830 | 20.4% |
[ 23.5% - 24.0% ] 23.86% | 127,371 | 14.6% |
[ 24.0% - 24.5% ] 24.23% | 331,557 | 8.1% |
[ 24.5% - 25.0% ] 24.69% | 201,469 | 10.2% |
[ 25.0% - 25.5% ] 25.21% | 228,829 | 8.5% |
[ 25.5% - 26.0% ] 25.63% | 146,700 | 9.1% |
[ 26.0% - 26.5% ] 26.20% | 85,870 | 11.5% |
[ 26.5% - 27.0% ] 26.79% | 361,553 | 4.0% |
[ 27.0% - 27.5% ] 27.07% | 143,942 | 7.7% |
[ 27.5% - 28.0% ] 27.85% | 98,492 | 12.4% |
[ 28.0% - 28.5% ] 28.24% | 78,569 | 16.2% |
[ 28.5% - 29.0% ] 28.77% | 20,756 | 17.8% |
[ 29.0% - 29.5% ] 29.24% | 151,835 | 5.0% |
[ 29.5% - 30.0% ] 29.78% | 45,658 | 34.2% |
[ 30.0% - 30.5% ] 30.02% | 34,857 | 5.7% |
[ 30.5% - 31.0% ] 30.73% | 120,528 | 13.6% |
[ 31.0% - 31.5% ] 31.20% | 114,871 | 6.6% |
[ 31.5% - 32.0% ] 31.74% | 170,545 | 2.6% |
[ 32.0% - 32.5% ] 32.11% | 67,972 | 6.9% |
[ 32.5% - 33.0% ] 32.69% | 79,134 | 4.7% |
[ 33.5% - 34.0% ] 33.76% | 10,932 | 25.2% |
[ 34.0% - 34.5% ] 34.13% | 21,774 | 1.3% |
[ 34.5% - 35.0% ] 34.55% | 76,780 | 9.0% |
[ 35.0% - 35.5% ] 35.18% | 83,471 | 3.2% |
[ 35.5% - 36.0% ] 35.74% | 5,901 | 25.5% |
[ 36.0% - 36.5% ] 36.13% | 501 | 15.4% |
[ 36.5% - 37.0% ] 36.63% | 718 | 100.0% |
[ 37.0% - 37.5% ] 37.36% | 704 | 100.0% |
[ 37.5% - 38.0% ] 37.80% | 40,000 | 3.8% |
[ 38.0% - 38.5% ] 38.38% | 86,445 | 1.6% |
[ 40.0% - 40.5% ] 40.49% | 452 | 100.0% |
[ 42.0% - 42.5% ] 42.22% | 45 | 100.0% |
[ 44.5% - 45.0% ] 44.89% | 1,243 | 24.3% |
[ 46.0% - 46.5% ] 46.11% | 5,097 | 21.0% |
[ 46.5% - 47.0% ] 46.97% | 198 | 100.0% |