English Wage/Income Gap
COMPARE
English
Select to Compare
Wage/Income Gap
English Wage/Income Gap
29.5%
WAGE/INCOME GAP
0.0/ 100
METRIC RATING
336th/ 347
METRIC RANK
English Wage/Income Gap Correlation Chart
The statistical analysis conducted on geographies consisting of 575,625,723 people shows a moderate positive correlation between the proportion of English and wage/income gap percentage in the United States with a correlation coefficient (R) of 0.482 and weighted average of 29.5%. On average, for every 1% (one percent) increase in English within a typical geography, there is an increase of 0.37% in wage/income gap percentage.
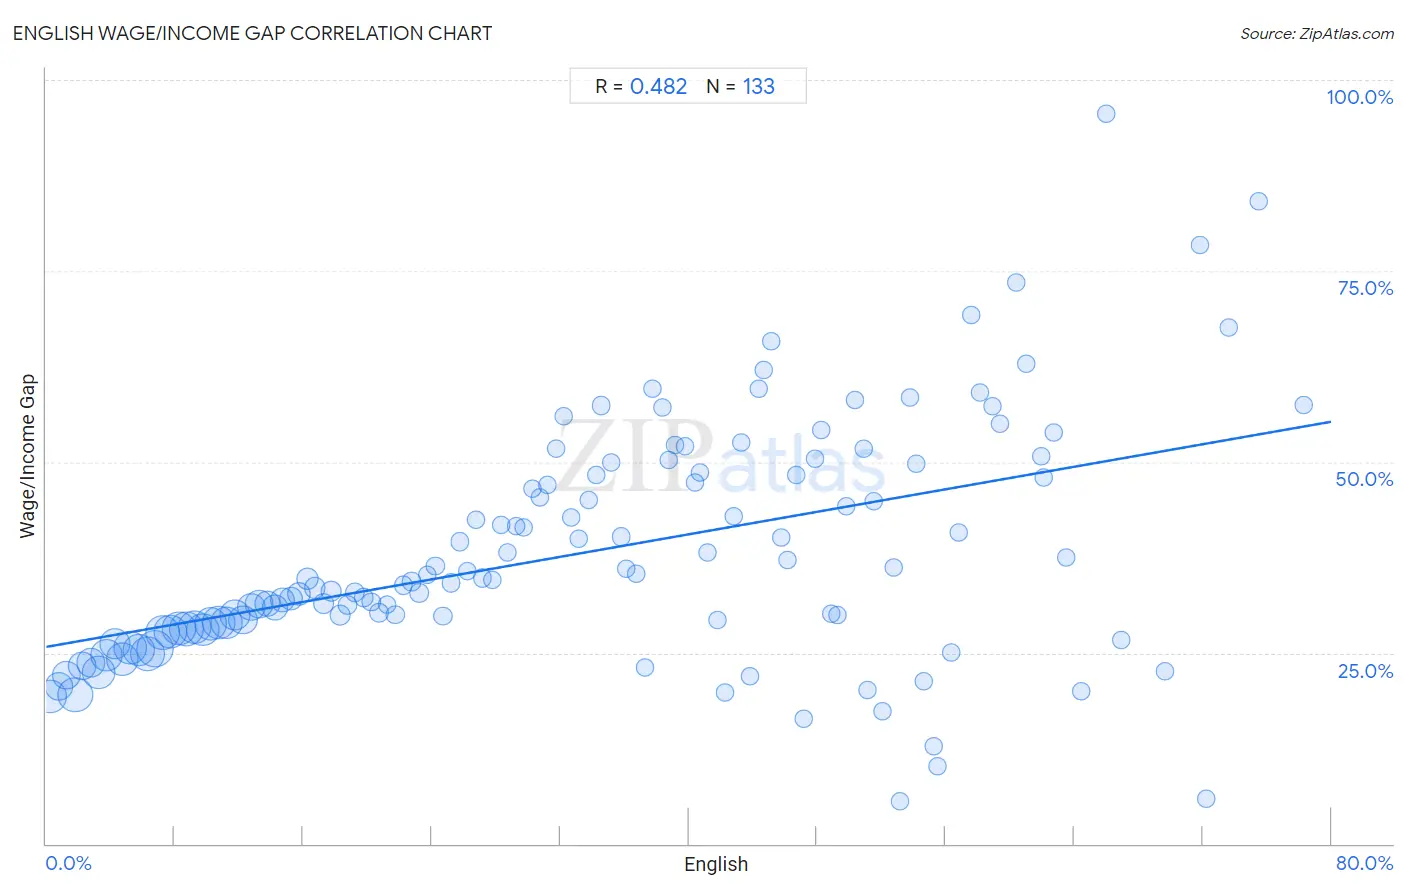
It is essential to understand that the correlation between the percentage of English and wage/income gap percentage does not imply a direct cause-and-effect relationship. It remains uncertain whether the presence of English influences an upward or downward trend in the level of wage/income gap percentage within an area, or if English simply ended up residing in those areas with higher or lower levels of wage/income gap percentage due to other factors.
Demographics Similar to English by Wage/Income Gap
In terms of wage/income gap, the demographic groups most similar to English are Immigrants from Taiwan (29.5%, a difference of 0.010%), Swedish (29.4%, a difference of 0.14%), European (29.4%, a difference of 0.28%), Immigrants from South Central Asia (29.3%, a difference of 0.47%), and Dutch (29.6%, a difference of 0.58%).
| Demographics | Rating | Rank | Wage/Income Gap |
| Scottish | 0.0 /100 | #329 | Tragic 29.1% |
| Germans | 0.0 /100 | #330 | Tragic 29.2% |
| Czechs | 0.0 /100 | #331 | Tragic 29.2% |
| Immigrants from South Central Asia | 0.0 /100 | #332 | Tragic 29.3% |
| Europeans | 0.0 /100 | #333 | Tragic 29.4% |
| Swedes | 0.0 /100 | #334 | Tragic 29.4% |
| Immigrants from Taiwan | 0.0 /100 | #335 | Tragic 29.5% |
| English | 0.0 /100 | #336 | Tragic 29.5% |
| Dutch | 0.0 /100 | #337 | Tragic 29.6% |
| Filipinos | 0.0 /100 | #338 | Tragic 29.7% |
| Iranians | 0.0 /100 | #339 | Tragic 29.7% |
| Swiss | 0.0 /100 | #340 | Tragic 30.0% |
| Thais | 0.0 /100 | #341 | Tragic 30.5% |
| Pennsylvania Germans | 0.0 /100 | #342 | Tragic 30.7% |
| Danes | 0.0 /100 | #343 | Tragic 31.0% |
English Wage/Income Gap Correlation Summary
| Measurement | English Data | Wage/Income Gap Data |
| Minimum | 0.25% | 5.6% |
| Maximum | 78.3% | 95.6% |
| Range | 78.0% | 90.1% |
| Mean | 33.8% | 38.2% |
| Median | 33.2% | 34.6% |
| Interquartile 25% (IQ1) | 16.5% | 28.2% |
| Interquartile 75% (IQ3) | 50.1% | 48.5% |
| Interquartile Range (IQR) | 33.6% | 20.3% |
| Standard Deviation (Sample) | 20.2% | 15.5% |
| Standard Deviation (Population) | 20.1% | 15.4% |
Correlation Details
| English Percentile | Sample Size | Wage/Income Gap |
[ 0.0% - 0.5% ] 0.25% | 19,584,115 | 19.3% |
[ 0.5% - 1.0% ] 0.76% | 13,045,849 | 20.7% |
[ 1.0% - 1.5% ] 1.24% | 13,021,151 | 22.1% |
[ 1.5% - 2.0% ] 1.81% | 22,599,940 | 19.5% |
[ 2.0% - 2.5% ] 2.25% | 14,371,583 | 23.3% |
[ 2.5% - 3.0% ] 2.77% | 14,624,313 | 23.8% |
[ 3.0% - 3.5% ] 3.23% | 20,490,069 | 22.4% |
[ 3.5% - 4.0% ] 3.75% | 17,886,655 | 24.7% |
[ 4.0% - 4.5% ] 4.25% | 16,909,255 | 26.2% |
[ 4.5% - 5.0% ] 4.72% | 18,984,053 | 24.2% |
[ 5.0% - 5.5% ] 5.25% | 19,588,966 | 25.6% |
[ 5.5% - 6.0% ] 5.75% | 18,441,161 | 25.4% |
[ 6.0% - 6.5% ] 6.28% | 21,674,425 | 24.9% |
[ 6.5% - 7.0% ] 6.75% | 25,182,644 | 25.6% |
[ 7.0% - 7.5% ] 7.26% | 21,461,825 | 27.6% |
[ 7.5% - 8.0% ] 7.74% | 19,279,633 | 27.7% |
[ 8.0% - 8.5% ] 8.25% | 21,145,243 | 28.2% |
[ 8.5% - 9.0% ] 8.74% | 21,310,267 | 28.1% |
[ 9.0% - 9.5% ] 9.26% | 20,996,041 | 28.4% |
[ 9.5% - 10.0% ] 9.75% | 19,339,266 | 28.0% |
[ 10.0% - 10.5% ] 10.24% | 19,943,194 | 28.8% |
[ 10.5% - 11.0% ] 10.75% | 20,096,651 | 28.9% |
[ 11.0% - 11.5% ] 11.24% | 17,725,027 | 28.9% |
[ 11.5% - 12.0% ] 11.74% | 16,952,148 | 29.9% |
[ 12.0% - 12.5% ] 12.25% | 13,788,438 | 29.2% |
[ 12.5% - 13.0% ] 12.75% | 13,249,534 | 31.0% |
[ 13.0% - 13.5% ] 13.25% | 12,503,854 | 31.4% |
[ 13.5% - 14.0% ] 13.75% | 10,255,510 | 31.4% |
[ 14.0% - 14.5% ] 14.26% | 10,021,007 | 31.0% |
[ 14.5% - 15.0% ] 14.74% | 8,561,571 | 31.9% |
[ 15.0% - 15.5% ] 15.24% | 7,157,486 | 32.1% |
[ 15.5% - 16.0% ] 15.74% | 6,284,387 | 32.7% |
[ 16.0% - 16.5% ] 16.26% | 5,047,142 | 34.7% |
[ 16.5% - 17.0% ] 16.74% | 3,928,035 | 33.5% |
[ 17.0% - 17.5% ] 17.25% | 3,642,256 | 31.4% |
[ 17.5% - 18.0% ] 17.74% | 3,555,914 | 33.1% |
[ 18.0% - 18.5% ] 18.28% | 3,011,576 | 29.9% |
[ 18.5% - 19.0% ] 18.73% | 1,708,599 | 31.3% |
[ 19.0% - 19.5% ] 19.24% | 2,027,868 | 32.9% |
[ 19.5% - 20.0% ] 19.74% | 1,642,836 | 32.2% |
[ 20.0% - 20.5% ] 20.24% | 1,456,272 | 31.7% |
[ 20.5% - 21.0% ] 20.74% | 977,990 | 30.2% |
[ 21.0% - 21.5% ] 21.23% | 1,096,980 | 31.3% |
[ 21.5% - 22.0% ] 21.75% | 771,495 | 30.0% |
[ 22.0% - 22.5% ] 22.24% | 963,608 | 33.8% |
[ 22.5% - 23.0% ] 22.76% | 754,642 | 34.3% |
[ 23.0% - 23.5% ] 23.22% | 488,574 | 32.8% |
[ 23.5% - 24.0% ] 23.74% | 514,758 | 35.2% |
[ 24.0% - 24.5% ] 24.22% | 642,540 | 36.3% |
[ 24.5% - 25.0% ] 24.70% | 498,585 | 29.9% |
[ 25.0% - 25.5% ] 25.22% | 568,914 | 34.2% |
[ 25.5% - 26.0% ] 25.73% | 496,994 | 39.6% |
[ 26.0% - 26.5% ] 26.22% | 430,100 | 35.7% |
[ 26.5% - 27.0% ] 26.74% | 645,981 | 42.5% |
[ 27.0% - 27.5% ] 27.18% | 302,077 | 34.8% |
[ 27.5% - 28.0% ] 27.76% | 355,304 | 34.6% |
[ 28.0% - 28.5% ] 28.31% | 306,407 | 41.8% |
[ 28.5% - 29.0% ] 28.71% | 199,623 | 38.2% |
[ 29.0% - 29.5% ] 29.25% | 360,439 | 41.6% |
[ 29.5% - 30.0% ] 29.75% | 240,354 | 41.4% |
[ 30.0% - 30.5% ] 30.26% | 125,295 | 46.5% |
[ 30.5% - 31.0% ] 30.72% | 254,916 | 45.4% |
[ 31.0% - 31.5% ] 31.22% | 257,192 | 46.9% |
[ 31.5% - 32.0% ] 31.75% | 321,638 | 51.7% |
[ 32.0% - 32.5% ] 32.18% | 174,191 | 56.0% |
[ 32.5% - 33.0% ] 32.71% | 115,834 | 42.7% |
[ 33.0% - 33.5% ] 33.18% | 84,886 | 40.0% |
[ 33.5% - 34.0% ] 33.80% | 42,571 | 45.0% |
[ 34.0% - 34.5% ] 34.22% | 77,095 | 48.2% |
[ 34.5% - 35.0% ] 34.57% | 255,515 | 57.4% |
[ 35.0% - 35.5% ] 35.19% | 116,573 | 49.9% |
[ 35.5% - 36.0% ] 35.83% | 147,977 | 40.2% |
[ 36.0% - 36.5% ] 36.12% | 42,618 | 36.1% |
[ 36.5% - 37.0% ] 36.76% | 14,348 | 35.4% |
[ 37.0% - 37.5% ] 37.27% | 8,098 | 23.0% |
[ 37.5% - 38.0% ] 37.74% | 111,436 | 59.6% |
[ 38.0% - 38.5% ] 38.35% | 102,842 | 57.1% |
[ 38.5% - 39.0% ] 38.77% | 17,171 | 50.3% |
[ 39.0% - 39.5% ] 39.17% | 19,049 | 52.1% |
[ 39.5% - 40.0% ] 39.78% | 17,384 | 52.0% |
[ 40.0% - 40.5% ] 40.38% | 14,956 | 47.3% |
[ 40.5% - 41.0% ] 40.71% | 28,172 | 48.7% |
[ 41.0% - 41.5% ] 41.17% | 5,912 | 38.2% |
[ 41.5% - 42.0% ] 41.78% | 8,646 | 29.3% |
[ 42.0% - 42.5% ] 42.23% | 18,939 | 19.8% |
[ 42.5% - 43.0% ] 42.80% | 8,986 | 42.8% |
[ 43.0% - 43.5% ] 43.28% | 8,979 | 52.5% |
[ 43.5% - 44.0% ] 43.79% | 5,467 | 22.0% |
[ 44.0% - 44.5% ] 44.37% | 1,208 | 59.6% |
[ 44.5% - 45.0% ] 44.66% | 13,861 | 62.0% |
[ 45.0% - 45.5% ] 45.13% | 25,504 | 65.9% |
[ 45.5% - 46.0% ] 45.78% | 10,075 | 40.1% |
[ 46.0% - 46.5% ] 46.13% | 8,633 | 37.1% |
[ 46.5% - 47.0% ] 46.67% | 4,956 | 48.3% |
[ 47.0% - 47.5% ] 47.15% | 1,404 | 16.4% |
[ 47.5% - 48.0% ] 47.83% | 2,214 | 50.5% |
[ 48.0% - 48.5% ] 48.27% | 1,709 | 54.1% |
[ 48.5% - 49.0% ] 48.85% | 1,519 | 30.1% |
[ 49.0% - 49.5% ] 49.30% | 781 | 29.9% |
[ 49.5% - 50.0% ] 49.84% | 3,818 | 44.3% |
[ 50.0% - 50.5% ] 50.32% | 1,081 | 58.1% |
[ 50.5% - 51.0% ] 50.90% | 4,969 | 51.8% |
[ 51.0% - 51.5% ] 51.15% | 913 | 20.1% |
[ 51.5% - 52.0% ] 51.52% | 66 | 44.9% |
[ 52.0% - 52.5% ] 52.07% | 651 | 17.3% |
[ 52.5% - 53.0% ] 52.80% | 644 | 36.1% |
[ 53.0% - 53.5% ] 53.12% | 32 | 5.6% |
[ 53.5% - 54.0% ] 53.78% | 1,852 | 58.4% |
[ 54.0% - 54.5% ] 54.15% | 1,132 | 49.8% |
[ 54.5% - 55.0% ] 54.65% | 2,002 | 21.3% |
[ 55.0% - 55.5% ] 55.28% | 398 | 12.8% |
[ 55.5% - 56.0% ] 55.51% | 708 | 10.2% |
[ 56.0% - 56.5% ] 56.36% | 2,493 | 25.1% |
[ 56.5% - 57.0% ] 56.85% | 628 | 40.7% |
[ 57.5% - 58.0% ] 57.58% | 297 | 69.2% |
[ 58.0% - 58.5% ] 58.14% | 215 | 59.0% |
[ 58.5% - 59.0% ] 58.93% | 750 | 57.2% |
[ 59.0% - 59.5% ] 59.41% | 372 | 55.0% |
[ 60.0% - 60.5% ] 60.38% | 1,479 | 73.5% |
[ 61.0% - 61.5% ] 61.01% | 1,490 | 62.8% |
[ 61.5% - 62.0% ] 61.94% | 1,085 | 50.7% |
[ 62.0% - 62.5% ] 62.10% | 1,488 | 48.0% |
[ 62.5% - 63.0% ] 62.71% | 724 | 53.9% |
[ 63.0% - 63.5% ] 63.50% | 400 | 37.4% |
[ 64.0% - 64.5% ] 64.41% | 3,088 | 19.9% |
[ 66.0% - 66.5% ] 66.03% | 209 | 95.6% |
[ 66.5% - 67.0% ] 66.93% | 127 | 26.7% |
[ 69.5% - 70.0% ] 69.65% | 257 | 22.6% |
[ 71.5% - 72.0% ] 71.79% | 312 | 78.5% |
[ 72.0% - 72.5% ] 72.23% | 443 | 5.8% |
[ 73.5% - 74.0% ] 73.64% | 607 | 67.6% |
[ 75.0% - 75.5% ] 75.50% | 951 | 84.1% |
[ 78.0% - 78.5% ] 78.26% | 368 | 57.5% |