English 4 or more Vehicles in Household
COMPARE
English
Select to Compare
4 or more Vehicles in Household
English 4 or more Vehicles in Household
7.6%
4+ VEHICLES AVAILABLE
100.0/ 100
METRIC RATING
56th/ 347
METRIC RANK
English 4 or more Vehicles in Household Correlation Chart
The statistical analysis conducted on geographies consisting of 575,671,099 people shows a strong positive correlation between the proportion of English and percentage of households with 4 or more vehicles available in the United States with a correlation coefficient (R) of 0.738 and weighted average of 7.6%. On average, for every 1% (one percent) increase in English within a typical geography, there is an increase of 0.45% in percentage of households with 4 or more vehicles available.
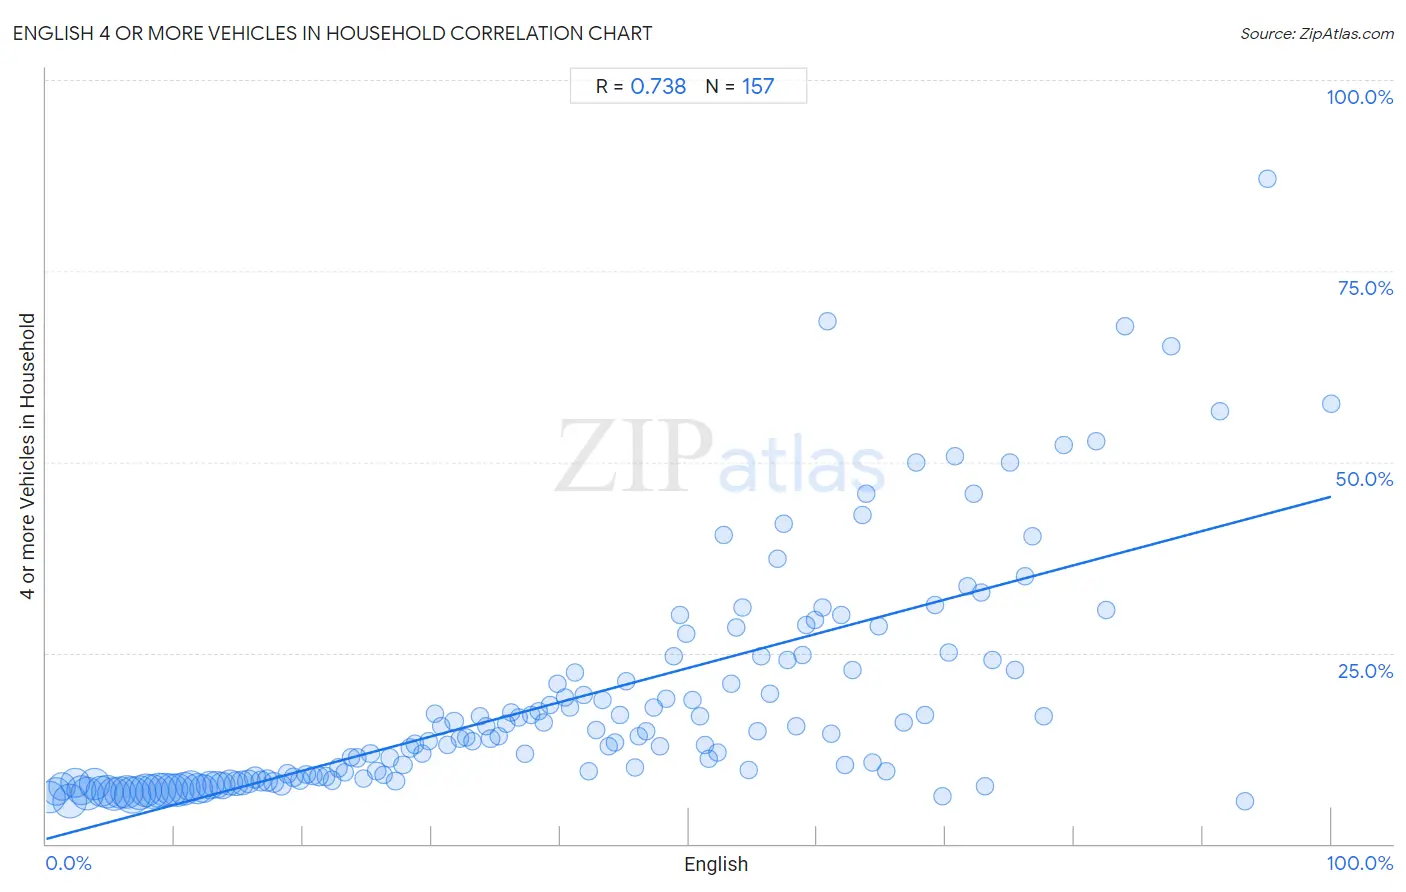
It is essential to understand that the correlation between the percentage of English and percentage of households with 4 or more vehicles available does not imply a direct cause-and-effect relationship. It remains uncertain whether the presence of English influences an upward or downward trend in the level of percentage of households with 4 or more vehicles available within an area, or if English simply ended up residing in those areas with higher or lower levels of percentage of households with 4 or more vehicles available due to other factors.
Demographics Similar to English by 4 or more Vehicles in Household
In terms of 4 or more vehicles in household, the demographic groups most similar to English are Immigrants from Oceania (7.6%, a difference of 0.010%), Pennsylvania German (7.6%, a difference of 0.12%), Swedish (7.6%, a difference of 0.12%), Hispanic or Latino (7.6%, a difference of 0.16%), and Spaniard (7.6%, a difference of 0.22%).
| Demographics | Rating | Rank | 4 or more Vehicles in Household |
| Cherokee | 100.0 /100 | #49 | Exceptional 7.7% |
| Immigrants from El Salvador | 100.0 /100 | #50 | Exceptional 7.7% |
| Immigrants from Laos | 100.0 /100 | #51 | Exceptional 7.7% |
| Japanese | 100.0 /100 | #52 | Exceptional 7.7% |
| Malaysians | 100.0 /100 | #53 | Exceptional 7.7% |
| Dutch | 100.0 /100 | #54 | Exceptional 7.7% |
| Immigrants from Oceania | 100.0 /100 | #55 | Exceptional 7.6% |
| English | 100.0 /100 | #56 | Exceptional 7.6% |
| Pennsylvania Germans | 100.0 /100 | #57 | Exceptional 7.6% |
| Swedes | 100.0 /100 | #58 | Exceptional 7.6% |
| Hispanics or Latinos | 100.0 /100 | #59 | Exceptional 7.6% |
| Spaniards | 100.0 /100 | #60 | Exceptional 7.6% |
| Europeans | 100.0 /100 | #61 | Exceptional 7.6% |
| Chippewa | 100.0 /100 | #62 | Exceptional 7.6% |
| Immigrants from Micronesia | 100.0 /100 | #63 | Exceptional 7.6% |
English 4 or more Vehicles in Household Correlation Summary
| Measurement | English Data | 4 or more Vehicles in Household Data |
| Minimum | 0.25% | 5.6% |
| Maximum | 100.0% | 87.1% |
| Range | 99.8% | 81.5% |
| Mean | 40.2% | 18.6% |
| Median | 39.2% | 13.7% |
| Interquartile 25% (IQ1) | 19.5% | 8.3% |
| Interquartile 75% (IQ3) | 59.0% | 22.8% |
| Interquartile Range (IQR) | 39.5% | 14.5% |
| Standard Deviation (Sample) | 24.4% | 14.8% |
| Standard Deviation (Population) | 24.3% | 14.8% |
Correlation Details
| English Percentile | Sample Size | 4 or more Vehicles in Household |
[ 0.0% - 0.5% ] 0.25% | 19,401,769 | 6.1% |
[ 0.5% - 1.0% ] 0.76% | 12,997,589 | 6.9% |
[ 1.0% - 1.5% ] 1.24% | 12,937,098 | 7.5% |
[ 1.5% - 2.0% ] 1.81% | 22,379,323 | 5.6% |
[ 2.0% - 2.5% ] 2.25% | 14,312,160 | 7.9% |
[ 2.5% - 3.0% ] 2.77% | 14,600,152 | 7.0% |
[ 3.0% - 3.5% ] 3.23% | 20,448,275 | 6.5% |
[ 3.5% - 4.0% ] 3.75% | 17,861,662 | 7.9% |
[ 4.0% - 4.5% ] 4.25% | 16,789,738 | 6.9% |
[ 4.5% - 5.0% ] 4.72% | 18,907,821 | 6.8% |
[ 5.0% - 5.5% ] 5.25% | 19,534,112 | 6.6% |
[ 5.5% - 6.0% ] 5.75% | 18,424,894 | 6.6% |
[ 6.0% - 6.5% ] 6.28% | 21,608,037 | 6.8% |
[ 6.5% - 7.0% ] 6.75% | 25,183,752 | 6.4% |
[ 7.0% - 7.5% ] 7.26% | 21,388,955 | 6.6% |
[ 7.5% - 8.0% ] 7.74% | 19,337,594 | 7.0% |
[ 8.0% - 8.5% ] 8.25% | 21,164,775 | 6.9% |
[ 8.5% - 9.0% ] 8.74% | 21,284,519 | 7.0% |
[ 9.0% - 9.5% ] 9.26% | 20,985,316 | 7.1% |
[ 9.5% - 10.0% ] 9.75% | 19,400,192 | 7.1% |
[ 10.0% - 10.5% ] 10.24% | 19,912,893 | 7.0% |
[ 10.5% - 11.0% ] 10.75% | 20,136,388 | 7.1% |
[ 11.0% - 11.5% ] 11.24% | 17,765,472 | 7.6% |
[ 11.5% - 12.0% ] 11.74% | 16,982,210 | 7.2% |
[ 12.0% - 12.5% ] 12.25% | 13,848,414 | 7.2% |
[ 12.5% - 13.0% ] 12.75% | 13,271,230 | 7.7% |
[ 13.0% - 13.5% ] 13.25% | 12,539,064 | 7.7% |
[ 13.5% - 14.0% ] 13.74% | 10,274,673 | 7.6% |
[ 14.0% - 14.5% ] 14.26% | 10,040,668 | 8.1% |
[ 14.5% - 15.0% ] 14.74% | 8,592,294 | 7.9% |
[ 15.0% - 15.5% ] 15.24% | 7,218,398 | 8.0% |
[ 15.5% - 16.0% ] 15.74% | 6,332,218 | 8.1% |
[ 16.0% - 16.5% ] 16.26% | 5,057,632 | 8.7% |
[ 16.5% - 17.0% ] 16.74% | 3,959,004 | 8.3% |
[ 17.0% - 17.5% ] 17.25% | 3,687,479 | 8.3% |
[ 17.5% - 18.0% ] 17.74% | 3,587,843 | 8.1% |
[ 18.0% - 18.5% ] 18.28% | 3,035,760 | 7.6% |
[ 18.5% - 19.0% ] 18.73% | 1,723,380 | 9.2% |
[ 19.0% - 19.5% ] 19.24% | 2,031,226 | 8.6% |
[ 19.5% - 20.0% ] 19.74% | 1,648,100 | 8.3% |
[ 20.0% - 20.5% ] 20.24% | 1,494,762 | 9.1% |
[ 20.5% - 21.0% ] 20.74% | 996,220 | 8.9% |
[ 21.0% - 21.5% ] 21.23% | 1,115,215 | 8.8% |
[ 21.5% - 22.0% ] 21.75% | 797,279 | 8.8% |
[ 22.0% - 22.5% ] 22.24% | 970,292 | 8.3% |
[ 22.5% - 23.0% ] 22.76% | 770,194 | 9.9% |
[ 23.0% - 23.5% ] 23.22% | 508,407 | 9.4% |
[ 23.5% - 24.0% ] 23.74% | 546,832 | 11.3% |
[ 24.0% - 24.5% ] 24.22% | 664,822 | 11.2% |
[ 24.5% - 25.0% ] 24.70% | 522,828 | 8.5% |
[ 25.0% - 25.5% ] 25.22% | 578,040 | 11.8% |
[ 25.5% - 26.0% ] 25.73% | 506,954 | 9.5% |
[ 26.0% - 26.5% ] 26.23% | 456,413 | 9.1% |
[ 26.5% - 27.0% ] 26.74% | 657,321 | 11.2% |
[ 27.0% - 27.5% ] 27.18% | 307,193 | 8.2% |
[ 27.5% - 28.0% ] 27.77% | 371,215 | 10.4% |
[ 28.0% - 28.5% ] 28.31% | 317,966 | 12.5% |
[ 28.5% - 29.0% ] 28.71% | 206,747 | 13.0% |
[ 29.0% - 29.5% ] 29.25% | 372,885 | 11.8% |
[ 29.5% - 30.0% ] 29.75% | 246,049 | 13.5% |
[ 30.0% - 30.5% ] 30.26% | 131,329 | 17.0% |
[ 30.5% - 31.0% ] 30.73% | 263,826 | 15.4% |
[ 31.0% - 31.5% ] 31.22% | 258,702 | 12.9% |
[ 31.5% - 32.0% ] 31.74% | 327,577 | 16.1% |
[ 32.0% - 32.5% ] 32.18% | 179,467 | 13.7% |
[ 32.5% - 33.0% ] 32.71% | 121,810 | 14.0% |
[ 33.0% - 33.5% ] 33.18% | 87,372 | 13.5% |
[ 33.5% - 34.0% ] 33.79% | 45,733 | 16.7% |
[ 34.0% - 34.5% ] 34.21% | 83,744 | 15.3% |
[ 34.5% - 35.0% ] 34.57% | 260,323 | 13.7% |
[ 35.0% - 35.5% ] 35.19% | 122,721 | 14.1% |
[ 35.5% - 36.0% ] 35.83% | 145,350 | 15.8% |
[ 36.0% - 36.5% ] 36.14% | 45,997 | 17.2% |
[ 36.5% - 37.0% ] 36.74% | 20,562 | 16.6% |
[ 37.0% - 37.5% ] 37.25% | 14,657 | 11.7% |
[ 37.5% - 38.0% ] 37.74% | 114,355 | 16.9% |
[ 38.0% - 38.5% ] 38.35% | 110,070 | 17.3% |
[ 38.5% - 39.0% ] 38.75% | 21,027 | 15.9% |
[ 39.0% - 39.5% ] 39.17% | 18,935 | 18.2% |
[ 39.5% - 40.0% ] 39.76% | 16,752 | 21.0% |
[ 40.0% - 40.5% ] 40.35% | 18,920 | 19.1% |
[ 40.5% - 41.0% ] 40.72% | 29,184 | 17.9% |
[ 41.0% - 41.5% ] 41.17% | 7,813 | 22.4% |
[ 41.5% - 42.0% ] 41.79% | 12,295 | 19.5% |
[ 42.0% - 42.5% ] 42.24% | 22,179 | 9.4% |
[ 42.5% - 43.0% ] 42.81% | 10,346 | 14.9% |
[ 43.0% - 43.5% ] 43.25% | 9,950 | 18.8% |
[ 43.5% - 44.0% ] 43.73% | 8,333 | 12.8% |
[ 44.0% - 44.5% ] 44.30% | 2,867 | 13.2% |
[ 44.5% - 45.0% ] 44.65% | 14,631 | 16.8% |
[ 45.0% - 45.5% ] 45.14% | 28,040 | 21.3% |
[ 45.5% - 46.0% ] 45.77% | 11,902 | 10.0% |
[ 46.0% - 46.5% ] 46.15% | 10,995 | 14.1% |
[ 46.5% - 47.0% ] 46.68% | 5,656 | 14.7% |
[ 47.0% - 47.5% ] 47.31% | 7,781 | 17.8% |
[ 47.5% - 48.0% ] 47.74% | 5,645 | 12.7% |
[ 48.0% - 48.5% ] 48.27% | 2,519 | 18.9% |
[ 48.5% - 49.0% ] 48.82% | 2,659 | 24.5% |
[ 49.0% - 49.5% ] 49.29% | 3,244 | 30.0% |
[ 49.5% - 50.0% ] 49.81% | 2,371 | 27.5% |
[ 50.0% - 50.5% ] 50.31% | 4,361 | 18.8% |
[ 50.5% - 51.0% ] 50.87% | 6,420 | 16.8% |
[ 51.0% - 51.5% ] 51.24% | 1,497 | 13.0% |
[ 51.5% - 52.0% ] 51.57% | 1,842 | 11.1% |
[ 52.0% - 52.5% ] 52.19% | 1,437 | 12.0% |
[ 52.5% - 53.0% ] 52.77% | 1,338 | 40.5% |
[ 53.0% - 53.5% ] 53.33% | 1,022 | 21.0% |
[ 53.5% - 54.0% ] 53.74% | 3,422 | 28.3% |
[ 54.0% - 54.5% ] 54.21% | 1,496 | 31.0% |
[ 54.5% - 55.0% ] 54.65% | 2,002 | 9.6% |
[ 55.0% - 55.5% ] 55.32% | 1,587 | 14.7% |
[ 55.5% - 56.0% ] 55.67% | 2,125 | 24.6% |
[ 56.0% - 56.5% ] 56.31% | 3,193 | 19.7% |
[ 56.5% - 57.0% ] 56.94% | 353 | 37.4% |
[ 57.0% - 57.5% ] 57.38% | 244 | 41.8% |
[ 57.5% - 58.0% ] 57.69% | 865 | 24.0% |
[ 58.0% - 58.5% ] 58.34% | 833 | 15.4% |
[ 58.5% - 59.0% ] 58.86% | 1,789 | 24.7% |
[ 59.0% - 59.5% ] 59.17% | 1,036 | 28.6% |
[ 59.5% - 60.0% ] 59.80% | 2,256 | 29.3% |
[ 60.0% - 60.5% ] 60.38% | 2,231 | 31.0% |
[ 60.5% - 61.0% ] 60.75% | 186 | 68.4% |
[ 61.0% - 61.5% ] 61.05% | 1,918 | 14.4% |
[ 61.5% - 62.0% ] 61.89% | 1,215 | 30.0% |
[ 62.0% - 62.5% ] 62.13% | 1,653 | 10.3% |
[ 62.5% - 63.0% ] 62.71% | 936 | 22.7% |
[ 63.0% - 63.5% ] 63.50% | 400 | 43.1% |
[ 63.5% - 64.0% ] 63.82% | 293 | 45.9% |
[ 64.0% - 64.5% ] 64.30% | 1,185 | 10.6% |
[ 64.5% - 65.0% ] 64.78% | 653 | 28.5% |
[ 65.0% - 65.5% ] 65.38% | 1,424 | 9.5% |
[ 66.5% - 67.0% ] 66.77% | 641 | 15.9% |
[ 67.5% - 68.0% ] 67.74% | 93 | 50.0% |
[ 68.0% - 68.5% ] 68.39% | 791 | 16.9% |
[ 69.0% - 69.5% ] 69.17% | 133 | 31.2% |
[ 69.5% - 70.0% ] 69.76% | 410 | 6.1% |
[ 70.0% - 70.5% ] 70.21% | 47 | 25.0% |
[ 70.5% - 71.0% ] 70.70% | 273 | 50.7% |
[ 71.5% - 72.0% ] 71.69% | 1,134 | 33.7% |
[ 72.0% - 72.5% ] 72.19% | 2,442 | 45.8% |
[ 72.5% - 73.0% ] 72.73% | 187 | 32.9% |
[ 73.0% - 73.5% ] 73.06% | 438 | 7.5% |
[ 73.5% - 74.0% ] 73.63% | 967 | 24.0% |
[ 75.0% - 75.5% ] 75.00% | 8 | 50.0% |
[ 75.0% - 75.5% ] 75.42% | 1,367 | 22.8% |
[ 76.0% - 76.5% ] 76.19% | 378 | 35.0% |
[ 76.5% - 77.0% ] 76.73% | 709 | 40.2% |
[ 77.5% - 78.0% ] 77.64% | 331 | 16.7% |
[ 79.0% - 79.5% ] 79.20% | 274 | 52.3% |
[ 81.5% - 82.0% ] 81.67% | 60 | 52.6% |
[ 82.0% - 82.5% ] 82.46% | 342 | 30.6% |
[ 83.5% - 84.0% ] 83.90% | 410 | 67.8% |
[ 87.0% - 87.5% ] 87.50% | 128 | 65.2% |
[ 91.0% - 91.5% ] 91.33% | 173 | 56.7% |
[ 93.0% - 93.5% ] 93.24% | 148 | 5.6% |
[ 95.0% - 95.5% ] 95.00% | 100 | 87.1% |
[ 99.5% - 100.0% ] 100.00% | 551 | 57.6% |