Eastern European Disability Age Under 5
COMPARE
Eastern European
Select to Compare
Disability Age Under 5
Eastern European Disability Age Under 5
1.4%
DISABILITY | AGE UNDER 5
1.0/ 100
METRIC RATING
248th/ 347
METRIC RANK
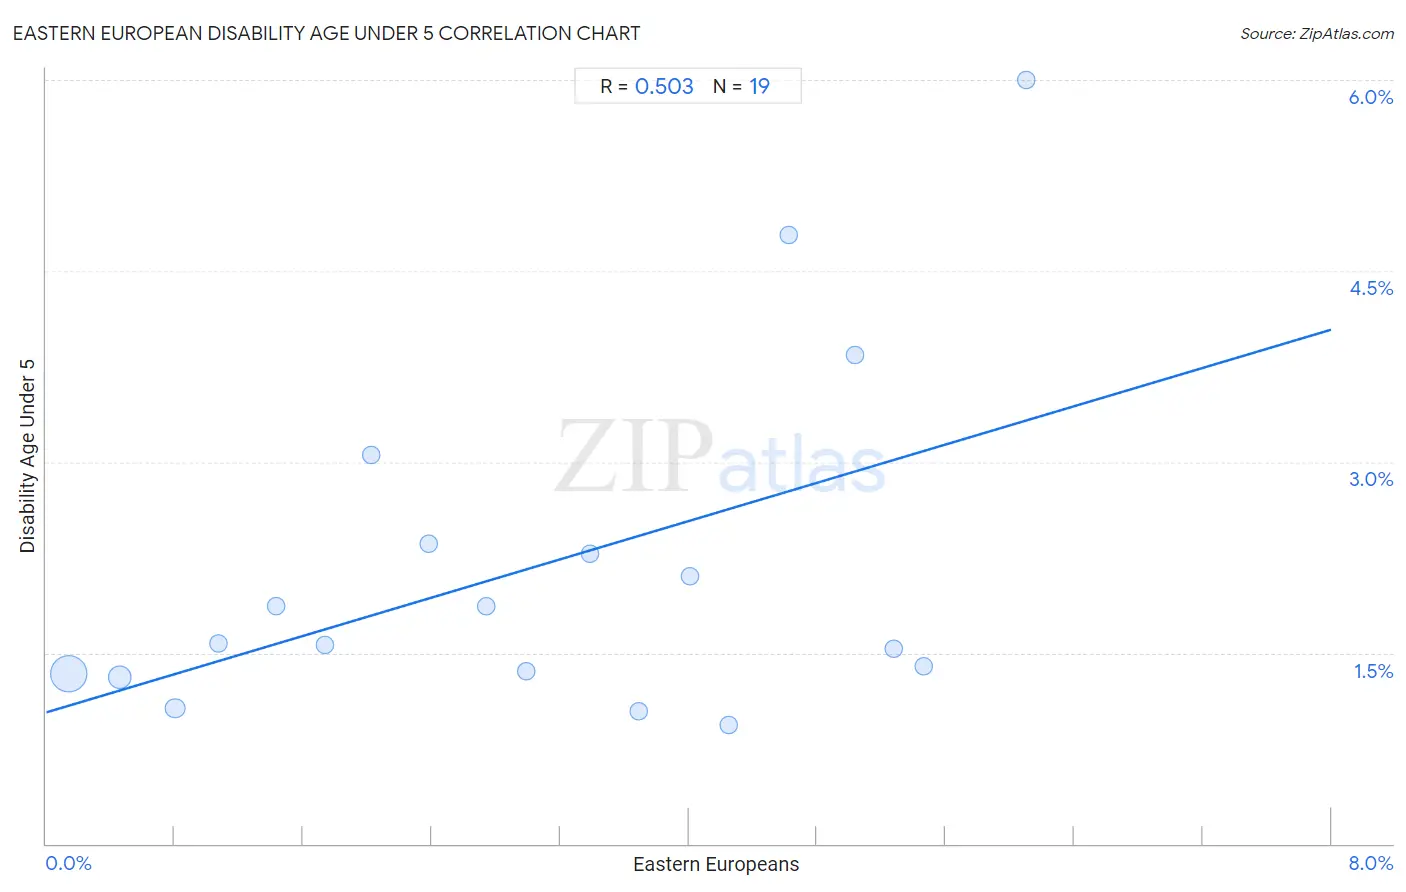
Eastern European Disability Age Under 5 Correlation Chart
The statistical analysis conducted on geographies consisting of 231,188,302 people shows a substantial positive correlation between the proportion of Eastern Europeans and percentage of population with a disability under the age of 5 in the United States with a correlation coefficient (R) of 0.503 and weighted average of 1.4%. On average, for every 1% (one percent) increase in Eastern Europeans within a typical geography, there is an increase of 0.38% in percentage of population with a disability under the age of 5.
It is essential to understand that the correlation between the percentage of Eastern Europeans and percentage of population with a disability under the age of 5 does not imply a direct cause-and-effect relationship. It remains uncertain whether the presence of Eastern Europeans influences an upward or downward trend in the level of percentage of population with a disability under the age of 5 within an area, or if Eastern Europeans simply ended up residing in those areas with higher or lower levels of percentage of population with a disability under the age of 5 due to other factors.
Demographics Similar to Eastern Europeans by Disability Age Under 5
In terms of disability age under 5, the demographic groups most similar to Eastern Europeans are Immigrants from England (1.4%, a difference of 0.030%), Russian (1.4%, a difference of 0.050%), Bermudan (1.4%, a difference of 0.080%), African (1.4%, a difference of 0.090%), and Immigrants from Hungary (1.4%, a difference of 0.12%).
| Demographics | Rating | Rank | Disability Age Under 5 |
| Maltese | 2.2 /100 | #241 | Tragic 1.3% |
| Lumbee | 2.1 /100 | #242 | Tragic 1.3% |
| Immigrants from Cameroon | 1.7 /100 | #243 | Tragic 1.4% |
| Spaniards | 1.4 /100 | #244 | Tragic 1.4% |
| Potawatomi | 1.1 /100 | #245 | Tragic 1.4% |
| Russians | 1.0 /100 | #246 | Tragic 1.4% |
| Immigrants from England | 1.0 /100 | #247 | Tragic 1.4% |
| Eastern Europeans | 1.0 /100 | #248 | Tragic 1.4% |
| Bermudans | 1.0 /100 | #249 | Tragic 1.4% |
| Africans | 1.0 /100 | #250 | Tragic 1.4% |
| Immigrants from Hungary | 1.0 /100 | #251 | Tragic 1.4% |
| Immigrants from Scotland | 0.9 /100 | #252 | Tragic 1.4% |
| Australians | 0.7 /100 | #253 | Tragic 1.4% |
| Immigrants from Brazil | 0.7 /100 | #254 | Tragic 1.4% |
| Immigrants from Liberia | 0.6 /100 | #255 | Tragic 1.4% |
Eastern European Disability Age Under 5 Correlation Summary
| Measurement | Eastern European Data | Disability Age Under 5 Data |
| Minimum | 0.14% | 0.93% |
| Maximum | 6.1% | 6.0% |
| Range | 6.0% | 5.1% |
| Mean | 3.0% | 2.2% |
| Median | 3.0% | 1.6% |
| Interquartile 25% (IQ1) | 1.4% | 1.3% |
| Interquartile 75% (IQ3) | 4.6% | 2.4% |
| Interquartile Range (IQR) | 3.2% | 1.0% |
| Standard Deviation (Sample) | 1.8% | 1.4% |
| Standard Deviation (Population) | 1.8% | 1.3% |
Correlation Details
| Eastern European Percentile | Sample Size | Disability Age Under 5 |
[ 0.0% - 0.5% ] 0.14% | 156,906,413 | 1.3% |
[ 0.0% - 0.5% ] 0.46% | 45,908,977 | 1.3% |
[ 0.5% - 1.0% ] 0.80% | 18,741,107 | 1.1% |
[ 1.0% - 1.5% ] 1.07% | 4,934,210 | 1.6% |
[ 1.0% - 1.5% ] 1.43% | 2,034,549 | 1.9% |
[ 1.5% - 2.0% ] 1.73% | 1,016,842 | 1.6% |
[ 2.0% - 2.5% ] 2.02% | 301,553 | 3.1% |
[ 2.0% - 2.5% ] 2.38% | 435,420 | 2.4% |
[ 2.5% - 3.0% ] 2.74% | 179,738 | 1.9% |
[ 2.5% - 3.0% ] 2.99% | 57,526 | 1.4% |
[ 3.0% - 3.5% ] 3.39% | 112,016 | 2.3% |
[ 3.5% - 4.0% ] 3.69% | 145,073 | 1.0% |
[ 4.0% - 4.5% ] 4.01% | 89,742 | 2.1% |
[ 4.0% - 4.5% ] 4.25% | 157,486 | 0.93% |
[ 4.5% - 5.0% ] 4.62% | 21,192 | 4.8% |
[ 5.0% - 5.5% ] 5.04% | 44,966 | 3.8% |
[ 5.0% - 5.5% ] 5.28% | 48,204 | 1.5% |
[ 5.0% - 5.5% ] 5.46% | 40,642 | 1.4% |
[ 6.0% - 6.5% ] 6.10% | 12,646 | 6.0% |