Eastern European Disability
COMPARE
Eastern European
Select to Compare
Disability
Eastern European Disability
11.2%
DISABILITY
97.8/ 100
METRIC RATING
95th/ 347
METRIC RANK
Eastern European Disability Correlation Chart
The statistical analysis conducted on geographies consisting of 461,211,417 people shows a weak positive correlation between the proportion of Eastern Europeans and percentage of population with a disability in the United States with a correlation coefficient (R) of 0.213 and weighted average of 11.2%. On average, for every 1% (one percent) increase in Eastern Europeans within a typical geography, there is an increase of 0.17% in percentage of population with a disability.
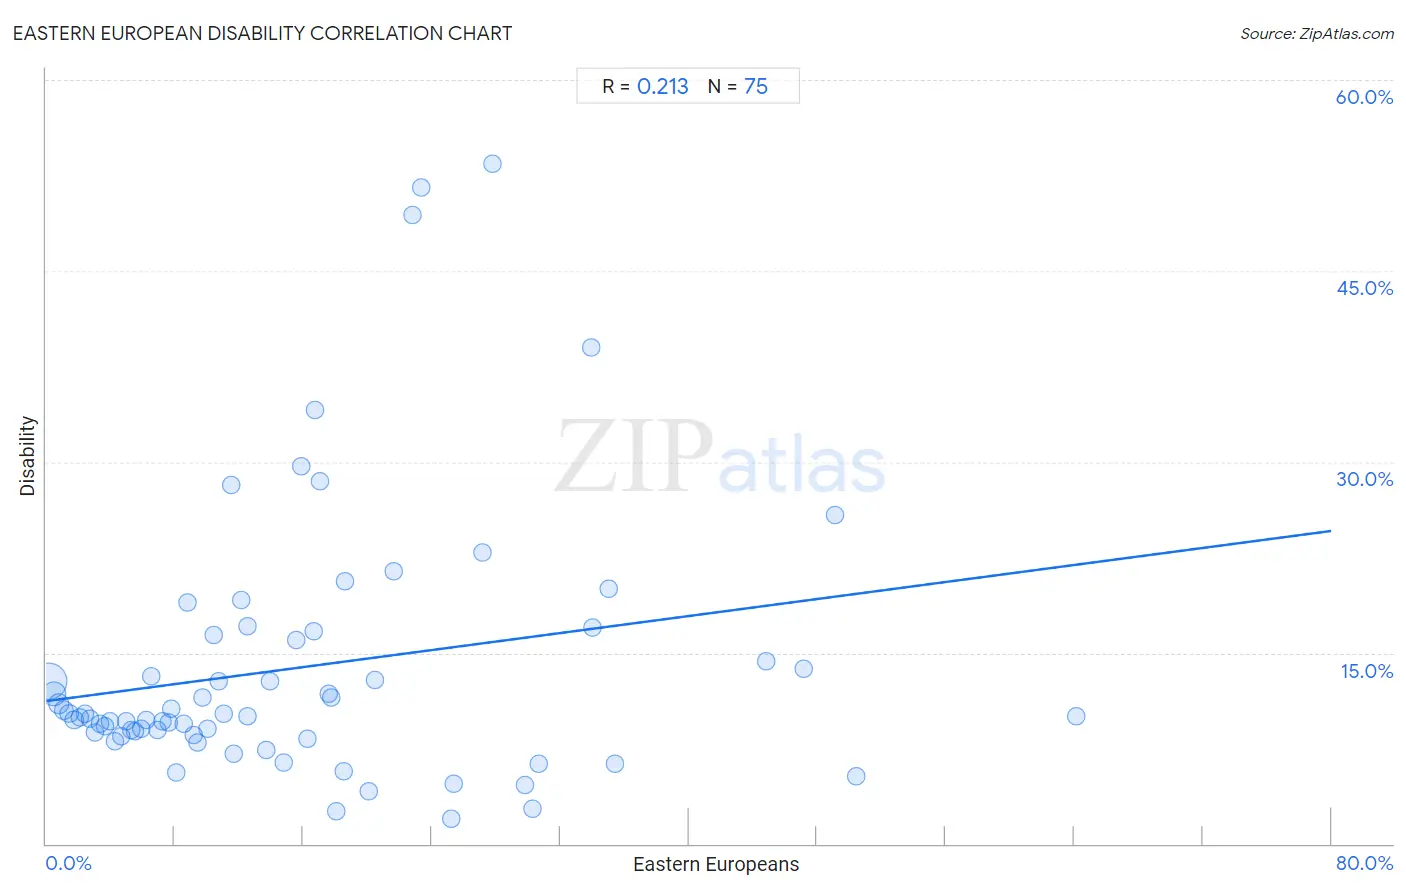
It is essential to understand that the correlation between the percentage of Eastern Europeans and percentage of population with a disability does not imply a direct cause-and-effect relationship. It remains uncertain whether the presence of Eastern Europeans influences an upward or downward trend in the level of percentage of population with a disability within an area, or if Eastern Europeans simply ended up residing in those areas with higher or lower levels of percentage of population with a disability due to other factors.
Demographics Similar to Eastern Europeans by Disability
In terms of disability, the demographic groups most similar to Eastern Europeans are Immigrants from Morocco (11.2%, a difference of 0.010%), Immigrants from Zimbabwe (11.2%, a difference of 0.060%), Immigrants from Ecuador (11.2%, a difference of 0.12%), Ecuadorian (11.2%, a difference of 0.13%), and Immigrants from Western Asia (11.2%, a difference of 0.16%).
| Demographics | Rating | Rank | Disability |
| Immigrants from Romania | 98.5 /100 | #88 | Exceptional 11.2% |
| Immigrants from South Africa | 98.2 /100 | #89 | Exceptional 11.2% |
| Immigrants from Brazil | 98.1 /100 | #90 | Exceptional 11.2% |
| Immigrants from Western Asia | 98.1 /100 | #91 | Exceptional 11.2% |
| Ecuadorians | 98.0 /100 | #92 | Exceptional 11.2% |
| Immigrants from Ecuador | 98.0 /100 | #93 | Exceptional 11.2% |
| Immigrants from Morocco | 97.8 /100 | #94 | Exceptional 11.2% |
| Eastern Europeans | 97.8 /100 | #95 | Exceptional 11.2% |
| Immigrants from Zimbabwe | 97.7 /100 | #96 | Exceptional 11.2% |
| Bhutanese | 97.4 /100 | #97 | Exceptional 11.2% |
| Uruguayans | 97.4 /100 | #98 | Exceptional 11.2% |
| Immigrants from Czechoslovakia | 97.4 /100 | #99 | Exceptional 11.2% |
| Immigrants from Greece | 96.9 /100 | #100 | Exceptional 11.3% |
| Immigrants from Nicaragua | 96.8 /100 | #101 | Exceptional 11.3% |
| Immigrants from Eastern Africa | 96.7 /100 | #102 | Exceptional 11.3% |
Eastern European Disability Correlation Summary
| Measurement | Eastern European Data | Disability Data |
| Minimum | 0.14% | 2.0% |
| Maximum | 64.1% | 53.4% |
| Range | 64.0% | 51.5% |
| Mean | 15.8% | 13.9% |
| Median | 12.2% | 10.0% |
| Interquartile 25% (IQ1) | 5.9% | 8.6% |
| Interquartile 75% (IQ3) | 21.7% | 16.4% |
| Interquartile Range (IQR) | 15.7% | 7.9% |
| Standard Deviation (Sample) | 13.4% | 10.5% |
| Standard Deviation (Population) | 13.3% | 10.4% |
Correlation Details
| Eastern European Percentile | Sample Size | Disability |
[ 0.0% - 0.5% ] 0.14% | 292,325,878 | 12.8% |
[ 0.0% - 0.5% ] 0.45% | 95,809,467 | 11.8% |
[ 0.5% - 1.0% ] 0.79% | 37,710,715 | 11.0% |
[ 1.0% - 1.5% ] 1.09% | 14,959,870 | 10.5% |
[ 1.0% - 1.5% ] 1.43% | 6,849,290 | 10.3% |
[ 1.5% - 2.0% ] 1.75% | 3,932,495 | 9.7% |
[ 2.0% - 2.5% ] 2.07% | 2,421,794 | 9.9% |
[ 2.0% - 2.5% ] 2.40% | 1,934,399 | 10.2% |
[ 2.5% - 3.0% ] 2.72% | 1,153,744 | 9.9% |
[ 3.0% - 3.5% ] 3.03% | 926,438 | 8.7% |
[ 3.0% - 3.5% ] 3.35% | 497,968 | 9.4% |
[ 3.5% - 4.0% ] 3.68% | 646,252 | 9.3% |
[ 3.5% - 4.0% ] 4.00% | 290,962 | 9.6% |
[ 4.0% - 4.5% ] 4.30% | 524,242 | 8.1% |
[ 4.5% - 5.0% ] 4.67% | 256,746 | 8.4% |
[ 4.5% - 5.0% ] 4.98% | 151,610 | 9.6% |
[ 5.0% - 5.5% ] 5.31% | 214,678 | 8.9% |
[ 5.5% - 6.0% ] 5.50% | 206,190 | 8.9% |
[ 5.5% - 6.0% ] 5.92% | 131,867 | 9.0% |
[ 6.0% - 6.5% ] 6.20% | 28,892 | 9.7% |
[ 6.5% - 7.0% ] 6.57% | 3,030 | 13.2% |
[ 6.5% - 7.0% ] 6.89% | 35,124 | 9.0% |
[ 7.0% - 7.5% ] 7.23% | 29,142 | 9.6% |
[ 7.5% - 8.0% ] 7.60% | 10,643 | 9.5% |
[ 7.5% - 8.0% ] 7.75% | 36,160 | 10.6% |
[ 8.0% - 8.5% ] 8.06% | 25,983 | 5.6% |
[ 8.5% - 9.0% ] 8.57% | 31,102 | 9.5% |
[ 8.5% - 9.0% ] 8.78% | 3,838 | 18.9% |
[ 9.0% - 9.5% ] 9.17% | 14,457 | 8.6% |
[ 9.0% - 9.5% ] 9.41% | 12,725 | 8.0% |
[ 9.5% - 10.0% ] 9.77% | 3,533 | 11.5% |
[ 10.0% - 10.5% ] 10.01% | 3,938 | 9.1% |
[ 10.0% - 10.5% ] 10.42% | 950 | 16.4% |
[ 10.5% - 11.0% ] 10.74% | 2,737 | 12.8% |
[ 11.0% - 11.5% ] 11.04% | 4,049 | 10.2% |
[ 11.5% - 12.0% ] 11.54% | 78 | 28.2% |
[ 11.5% - 12.0% ] 11.66% | 2,855 | 7.1% |
[ 12.0% - 12.5% ] 12.17% | 345 | 19.1% |
[ 12.0% - 12.5% ] 12.50% | 40 | 10.0% |
[ 12.5% - 13.0% ] 12.56% | 1,417 | 17.1% |
[ 13.5% - 14.0% ] 13.66% | 366 | 7.4% |
[ 13.5% - 14.0% ] 13.91% | 791 | 12.8% |
[ 14.5% - 15.0% ] 14.81% | 1,350 | 6.4% |
[ 15.5% - 16.0% ] 15.60% | 218 | 16.1% |
[ 15.5% - 16.0% ] 15.88% | 825 | 29.7% |
[ 16.0% - 16.5% ] 16.24% | 388 | 8.3% |
[ 16.5% - 17.0% ] 16.67% | 12 | 16.7% |
[ 16.5% - 17.0% ] 16.69% | 599 | 34.1% |
[ 17.0% - 17.5% ] 17.07% | 123 | 28.5% |
[ 17.5% - 18.0% ] 17.61% | 352 | 11.7% |
[ 17.5% - 18.0% ] 17.71% | 96 | 11.5% |
[ 18.0% - 18.5% ] 18.06% | 155 | 2.6% |
[ 18.5% - 19.0% ] 18.55% | 318 | 5.7% |
[ 18.5% - 19.0% ] 18.64% | 2,801 | 20.6% |
[ 20.0% - 20.5% ] 20.04% | 484 | 4.1% |
[ 20.0% - 20.5% ] 20.43% | 93 | 12.9% |
[ 21.5% - 22.0% ] 21.66% | 1,847 | 21.4% |
[ 22.5% - 23.0% ] 22.78% | 79 | 49.4% |
[ 23.0% - 23.5% ] 23.31% | 163 | 51.5% |
[ 25.0% - 25.5% ] 25.20% | 611 | 2.0% |
[ 25.0% - 25.5% ] 25.40% | 126 | 4.8% |
[ 27.0% - 27.5% ] 27.13% | 656 | 22.9% |
[ 27.5% - 28.0% ] 27.81% | 320 | 53.4% |
[ 29.5% - 30.0% ] 29.81% | 671 | 4.6% |
[ 30.0% - 30.5% ] 30.26% | 998 | 2.7% |
[ 30.5% - 31.0% ] 30.70% | 316 | 6.3% |
[ 33.5% - 34.0% ] 33.90% | 59 | 39.0% |
[ 34.0% - 34.5% ] 34.04% | 47 | 17.0% |
[ 35.0% - 35.5% ] 35.00% | 20 | 20.0% |
[ 35.0% - 35.5% ] 35.42% | 48 | 6.2% |
[ 44.5% - 45.0% ] 44.84% | 223 | 14.3% |
[ 47.0% - 47.5% ] 47.13% | 87 | 13.8% |
[ 49.0% - 49.5% ] 49.14% | 116 | 25.9% |
[ 50.0% - 50.5% ] 50.41% | 246 | 5.3% |
[ 64.0% - 64.5% ] 64.12% | 170 | 10.0% |