Eastern European Married-couple Households
COMPARE
Eastern European
Select to Compare
Married-couple Households
Eastern European Married-couple Households
48.6%
MARRIED-COUPLE HOUSEHOLDS
99.3/ 100
METRIC RATING
51st/ 347
METRIC RANK
Eastern European Married-couple Households Correlation Chart
The statistical analysis conducted on geographies consisting of 460,944,660 people shows a poor positive correlation between the proportion of Eastern Europeans and percentage of married-couple family households in the United States with a correlation coefficient (R) of 0.137 and weighted average of 48.6%. On average, for every 1% (one percent) increase in Eastern Europeans within a typical geography, there is an increase of 0.18% in percentage of married-couple family households.
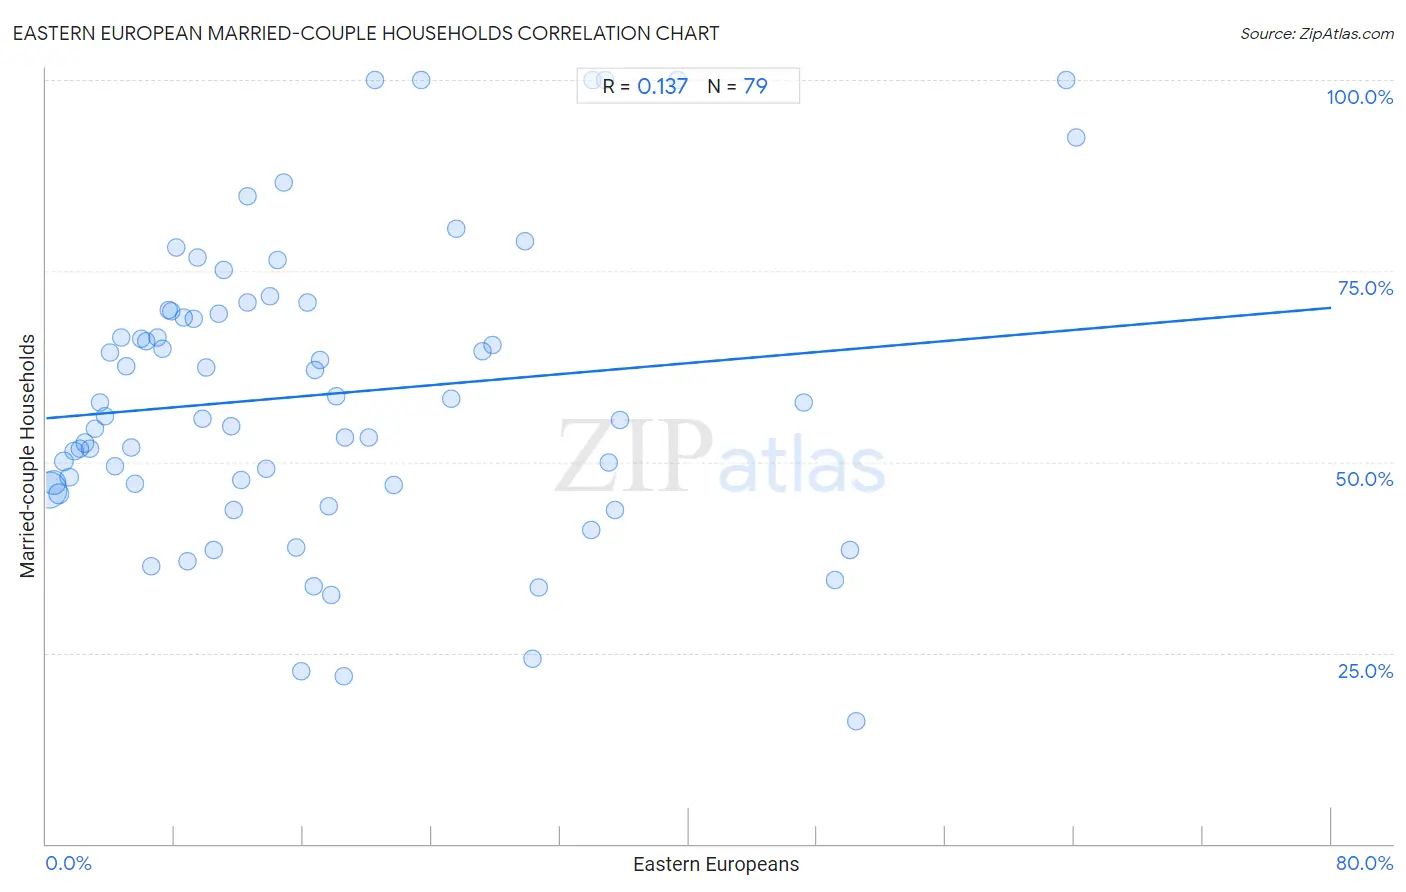
It is essential to understand that the correlation between the percentage of Eastern Europeans and percentage of married-couple family households does not imply a direct cause-and-effect relationship. It remains uncertain whether the presence of Eastern Europeans influences an upward or downward trend in the level of percentage of married-couple family households within an area, or if Eastern Europeans simply ended up residing in those areas with higher or lower levels of percentage of married-couple family households due to other factors.
Demographics Similar to Eastern Europeans by Married-couple Households
In terms of married-couple households, the demographic groups most similar to Eastern Europeans are Samoan (48.7%, a difference of 0.040%), Irish (48.6%, a difference of 0.040%), Immigrants from Sri Lanka (48.7%, a difference of 0.080%), White/Caucasian (48.6%, a difference of 0.090%), and Immigrants from Lithuania (48.6%, a difference of 0.090%).
| Demographics | Rating | Rank | Married-couple Households |
| Welsh | 99.5 /100 | #44 | Exceptional 48.8% |
| Immigrants from Eastern Asia | 99.5 /100 | #45 | Exceptional 48.8% |
| Tsimshian | 99.5 /100 | #46 | Exceptional 48.7% |
| British | 99.5 /100 | #47 | Exceptional 48.7% |
| Indians (Asian) | 99.4 /100 | #48 | Exceptional 48.7% |
| Immigrants from Sri Lanka | 99.4 /100 | #49 | Exceptional 48.7% |
| Samoans | 99.4 /100 | #50 | Exceptional 48.7% |
| Eastern Europeans | 99.3 /100 | #51 | Exceptional 48.6% |
| Irish | 99.3 /100 | #52 | Exceptional 48.6% |
| Whites/Caucasians | 99.3 /100 | #53 | Exceptional 48.6% |
| Immigrants from Lithuania | 99.3 /100 | #54 | Exceptional 48.6% |
| Austrians | 99.3 /100 | #55 | Exceptional 48.6% |
| Immigrants from Northern Europe | 99.3 /100 | #56 | Exceptional 48.6% |
| Poles | 99.2 /100 | #57 | Exceptional 48.5% |
| Immigrants from Indonesia | 99.2 /100 | #58 | Exceptional 48.5% |
Eastern European Married-couple Households Correlation Summary
| Measurement | Eastern European Data | Married-couple Households Data |
| Minimum | 0.14% | 16.0% |
| Maximum | 64.1% | 100.0% |
| Range | 64.0% | 84.0% |
| Mean | 17.2% | 58.8% |
| Median | 12.6% | 55.9% |
| Interquartile 25% (IQ1) | 6.2% | 47.0% |
| Interquartile 75% (IQ3) | 25.2% | 69.8% |
| Interquartile Range (IQR) | 19.0% | 22.8% |
| Standard Deviation (Sample) | 14.8% | 19.4% |
| Standard Deviation (Population) | 14.7% | 19.3% |
Correlation Details
| Eastern European Percentile | Sample Size | Married-couple Households |
[ 0.0% - 0.5% ] 0.14% | 292,201,802 | 46.4% |
[ 0.0% - 0.5% ] 0.45% | 95,736,069 | 47.3% |
[ 0.5% - 1.0% ] 0.79% | 37,672,554 | 45.8% |
[ 1.0% - 1.5% ] 1.09% | 14,939,851 | 50.1% |
[ 1.0% - 1.5% ] 1.43% | 6,845,401 | 48.0% |
[ 1.5% - 2.0% ] 1.75% | 3,923,124 | 51.4% |
[ 2.0% - 2.5% ] 2.07% | 2,420,799 | 51.8% |
[ 2.0% - 2.5% ] 2.40% | 1,934,399 | 52.5% |
[ 2.5% - 3.0% ] 2.72% | 1,153,744 | 51.8% |
[ 3.0% - 3.5% ] 3.03% | 926,861 | 54.3% |
[ 3.0% - 3.5% ] 3.35% | 497,968 | 57.8% |
[ 3.5% - 4.0% ] 3.68% | 646,252 | 55.9% |
[ 3.5% - 4.0% ] 4.00% | 291,372 | 64.3% |
[ 4.0% - 4.5% ] 4.30% | 524,242 | 49.5% |
[ 4.5% - 5.0% ] 4.67% | 256,746 | 66.3% |
[ 4.5% - 5.0% ] 4.98% | 151,610 | 62.5% |
[ 5.0% - 5.5% ] 5.31% | 214,531 | 51.9% |
[ 5.5% - 6.0% ] 5.50% | 206,190 | 47.2% |
[ 5.5% - 6.0% ] 5.92% | 131,867 | 66.1% |
[ 6.0% - 6.5% ] 6.20% | 28,892 | 65.8% |
[ 6.5% - 7.0% ] 6.57% | 3,030 | 36.4% |
[ 6.5% - 7.0% ] 6.89% | 35,124 | 66.2% |
[ 7.0% - 7.5% ] 7.23% | 29,326 | 64.7% |
[ 7.5% - 8.0% ] 7.60% | 10,643 | 69.9% |
[ 7.5% - 8.0% ] 7.75% | 36,160 | 69.8% |
[ 8.0% - 8.5% ] 8.06% | 25,839 | 78.0% |
[ 8.5% - 9.0% ] 8.57% | 31,102 | 68.9% |
[ 8.5% - 9.0% ] 8.78% | 3,838 | 36.9% |
[ 9.0% - 9.5% ] 9.17% | 14,832 | 68.7% |
[ 9.0% - 9.5% ] 9.41% | 12,725 | 76.7% |
[ 9.5% - 10.0% ] 9.77% | 3,533 | 55.6% |
[ 9.5% - 10.0% ] 10.00% | 4,632 | 62.4% |
[ 10.0% - 10.5% ] 10.42% | 950 | 38.5% |
[ 10.5% - 11.0% ] 10.75% | 3,071 | 69.4% |
[ 11.0% - 11.5% ] 11.04% | 4,049 | 75.1% |
[ 11.5% - 12.0% ] 11.54% | 130 | 54.7% |
[ 11.5% - 12.0% ] 11.67% | 3,273 | 43.7% |
[ 12.0% - 12.5% ] 12.17% | 345 | 47.6% |
[ 12.0% - 12.5% ] 12.50% | 40 | 70.8% |
[ 12.5% - 13.0% ] 12.57% | 1,472 | 84.7% |
[ 13.5% - 14.0% ] 13.66% | 366 | 49.2% |
[ 13.5% - 14.0% ] 13.93% | 1,005 | 71.7% |
[ 14.0% - 14.5% ] 14.43% | 97 | 76.4% |
[ 14.5% - 15.0% ] 14.81% | 1,350 | 86.6% |
[ 15.5% - 16.0% ] 15.60% | 218 | 38.7% |
[ 15.5% - 16.0% ] 15.88% | 825 | 22.6% |
[ 16.0% - 16.5% ] 16.24% | 388 | 70.8% |
[ 16.5% - 17.0% ] 16.67% | 24 | 33.8% |
[ 16.5% - 17.0% ] 16.69% | 599 | 62.0% |
[ 17.0% - 17.5% ] 17.07% | 123 | 63.3% |
[ 17.5% - 18.0% ] 17.61% | 352 | 44.2% |
[ 17.5% - 18.0% ] 17.71% | 96 | 32.6% |
[ 18.0% - 18.5% ] 18.06% | 155 | 58.6% |
[ 18.5% - 19.0% ] 18.55% | 318 | 21.9% |
[ 18.5% - 19.0% ] 18.64% | 2,801 | 53.1% |
[ 20.0% - 20.5% ] 20.04% | 484 | 53.2% |
[ 20.0% - 20.5% ] 20.43% | 93 | 100.0% |
[ 21.5% - 22.0% ] 21.66% | 1,847 | 47.0% |
[ 23.0% - 23.5% ] 23.31% | 163 | 100.0% |
[ 25.0% - 25.5% ] 25.20% | 611 | 58.2% |
[ 25.5% - 26.0% ] 25.54% | 372 | 80.6% |
[ 27.0% - 27.5% ] 27.13% | 656 | 64.5% |
[ 27.5% - 28.0% ] 27.81% | 320 | 65.4% |
[ 29.5% - 30.0% ] 29.81% | 671 | 79.0% |
[ 30.0% - 30.5% ] 30.26% | 998 | 24.1% |
[ 30.5% - 31.0% ] 30.70% | 316 | 33.6% |
[ 33.5% - 34.0% ] 33.90% | 59 | 41.0% |
[ 34.0% - 34.5% ] 34.04% | 47 | 100.0% |
[ 34.5% - 35.0% ] 34.78% | 46 | 100.0% |
[ 35.0% - 35.5% ] 35.00% | 20 | 50.0% |
[ 35.0% - 35.5% ] 35.42% | 48 | 43.8% |
[ 35.5% - 36.0% ] 35.71% | 28 | 55.6% |
[ 39.0% - 39.5% ] 39.29% | 56 | 100.0% |
[ 47.0% - 47.5% ] 47.13% | 87 | 57.8% |
[ 49.0% - 49.5% ] 49.14% | 116 | 34.5% |
[ 50.0% - 50.5% ] 50.00% | 16 | 38.5% |
[ 50.0% - 50.5% ] 50.41% | 246 | 16.0% |
[ 63.5% - 64.0% ] 63.53% | 85 | 100.0% |
[ 64.0% - 64.5% ] 64.12% | 170 | 92.5% |