Eastern European Self-Care Disability

COMPARE

Eastern European
Race
Ancestry
AfghanAfricanAlaska NativeAlaskan AthabascanAlbanianAleutAlsatianAmericanApacheArabArapahoArgentineanArmenianAssyrian/Chaldean/SyriacAustralianAustrianBahamianBangladeshiBarbadianBasqueBelgianBelizeanBermudanBhutaneseBlackfeetBolivianBrazilianBritishBritish West IndianBulgarianBurmeseCajunCambodianCanadianCape VerdeanCarpatho RusynCelticCentral AmericanCentral American IndianCherokeeCheyenneChickasawChileanChineseChippewaChoctawColombianColvilleComancheCosta RicanCreeCreekCroatianCrowCubanCypriotCzechCzechoslovakianDanishDelawareDominicanDutchDutch West IndianEastern EuropeanEcuadorianEgyptianEnglishEstonianEthiopianEuropeanFijianFilipinoFinnishFrenchFrench American IndianFrench CanadianGermanGerman RussianGhanaianGreekGuamanian/ChamorroGuatemalanGuyaneseHaitianHmongHonduranHopiHoumaHungarianIcelanderIndian (Asian)IndonesianInupiatIranianIraqiIrishIroquoisIsraeliItalianJamaicanJapaneseJordanianKenyanKiowaKoreanLaotianLatvianLebaneseLiberianLithuanianLumbeeLuxembourgerMacedonianMalaysianMalteseMarshalleseMenomineeMexicanMexican American IndianMongolianMoroccanNative HawaiianNavajoNepaleseNew ZealanderNicaraguanNigerianNorthern EuropeanNorwegianOkinawanOsageOttawaPaiutePakistaniPalestinianPanamanianParaguayanPennsylvania GermanPeruvianPimaPolishPortuguesePotawatomiPuebloPuerto RicanPuget Sound SalishRomanianRussianSalvadoranSamoanScandinavianScotch-IrishScottishSeminoleSenegaleseSerbianShoshoneSierra LeoneanSiouxSlavicSlovakSloveneSomaliSouth AfricanSouth AmericanSouth American IndianSoviet UnionSpaniardSpanishSpanish AmericanSpanish American IndianSri LankanSubsaharan AfricanSudaneseSwedishSwissSyrianTaiwaneseThaiTlingit-HaidaTohono O'OdhamTonganTrinidadian and TobagonianTsimshianTurkishU.S. Virgin IslanderUgandanUkrainianUruguayanUteVenezuelanVietnameseWelshWest IndianYakamaYaquiYugoslavianYumanYup'ikZimbabwean
Immigration
NonimmigrantsImmigrantsAfghanistanAfricaAlbaniaArgentinaArmeniaAsiaAustraliaAustriaBahamasBangladeshBarbadosBelarusBelgiumBelizeBoliviaBosnia and HerzegovinaBrazilBulgariaBurma/MyanmarCabo VerdeCambodiaCameroonCanadaCaribbeanCentral AmericaChileChinaColombiaCongoCosta RicaCroatiaCubaCzechoslovakiaDenmarkDominicaDominican RepublicEastern AfricaEastern AsiaEastern EuropeEcuadorEgyptEl SalvadorEnglandEritreaEthiopiaEuropeFijiFranceGermanyGhanaGreeceGrenadaGuatemalaGuyanaHaitiHondurasHong KongHungaryIndiaIndonesiaIranIraqIrelandIsraelItalyJamaicaJapanJordanKazakhstanKenyaKoreaKuwaitLaosLatin AmericaLatviaLebanonLiberiaLithuaniaMalaysiaMexicoMicronesiaMiddle AfricaMoldovaMoroccoNepalNetherlandsNicaraguaNigeriaNorth AmericaNorth MacedoniaNorthern AfricaNorthern EuropeNorwayOceaniaPakistanPanamaPeruPhilippinesPolandPortugalRomaniaRussiaSaudi ArabiaScotlandSenegalSerbiaSierra LeoneSingaporeSomaliaSouth AfricaSouth AmericaSouth Central AsiaSouth Eastern AsiaSouthern EuropeSpainSri LankaSt. Vincent and the GrenadinesSudanSwedenSwitzerlandSyriaTaiwanThailandTrinidad and TobagoTurkeyUgandaUkraineUruguayUzbekistanVenezuelaVietnamWest IndiesWestern AfricaWestern AsiaWestern EuropeYemenZaireZimbabweAzores
Select to Compare
Race
Ancestry
AfghanAfricanAlaska NativeAlaskan AthabascanAlbanianAleutAlsatianAmericanApacheArabArapahoArgentineanArmenianAssyrian/Chaldean/SyriacAustralianAustrianBahamianBangladeshiBarbadianBasqueBelgianBelizeanBermudanBhutaneseBlackfeetBolivianBrazilianBritishBritish West IndianBulgarianBurmeseCajunCambodianCanadianCape VerdeanCarpatho RusynCelticCentral AmericanCentral American IndianCherokeeCheyenneChickasawChileanChineseChippewaChoctawColombianColvilleComancheCosta RicanCreeCreekCroatianCrowCubanCypriotCzechCzechoslovakianDanishDelawareDominicanDutchDutch West IndianEcuadorianEgyptianEnglishEstonianEthiopianEuropeanFijianFilipinoFinnishFrenchFrench American IndianFrench CanadianGermanGerman RussianGhanaianGreekGuamanian/ChamorroGuatemalanGuyaneseHaitianHmongHonduranHopiHoumaHungarianIcelanderIndian (Asian)IndonesianInupiatIranianIraqiIrishIroquoisIsraeliItalianJamaicanJapaneseJordanianKenyanKiowaKoreanLaotianLatvianLebaneseLiberianLithuanianLumbeeLuxembourgerMacedonianMalaysianMalteseMarshalleseMenomineeMexicanMexican American IndianMongolianMoroccanNative HawaiianNavajoNepaleseNew ZealanderNicaraguanNigerianNorthern EuropeanNorwegianOkinawanOsageOttawaPaiutePakistaniPalestinianPanamanianParaguayanPennsylvania GermanPeruvianPimaPolishPortuguesePotawatomiPuebloPuerto RicanPuget Sound SalishRomanianRussianSalvadoranSamoanScandinavianScotch-IrishScottishSeminoleSenegaleseSerbianShoshoneSierra LeoneanSiouxSlavicSlovakSloveneSomaliSouth AfricanSouth AmericanSouth American IndianSoviet UnionSpaniardSpanishSpanish AmericanSpanish American IndianSri LankanSubsaharan AfricanSudaneseSwedishSwissSyrianTaiwaneseThaiTlingit-HaidaTohono O'OdhamTonganTrinidadian and TobagonianTsimshianTurkishU.S. Virgin IslanderUgandanUkrainianUruguayanUteVenezuelanVietnameseWelshWest IndianYakamaYaquiYugoslavianYumanYup'ikZimbabwean
Immigration
NonimmigrantsImmigrantsAfghanistanAfricaAlbaniaArgentinaArmeniaAsiaAustraliaAustriaBahamasBangladeshBarbadosBelarusBelgiumBelizeBoliviaBosnia and HerzegovinaBrazilBulgariaBurma/MyanmarCabo VerdeCambodiaCameroonCanadaCaribbeanCentral AmericaChileChinaColombiaCongoCosta RicaCroatiaCubaCzechoslovakiaDenmarkDominicaDominican RepublicEastern AfricaEastern AsiaEastern EuropeEcuadorEgyptEl SalvadorEnglandEritreaEthiopiaEuropeFijiFranceGermanyGhanaGreeceGrenadaGuatemalaGuyanaHaitiHondurasHong KongHungaryIndiaIndonesiaIranIraqIrelandIsraelItalyJamaicaJapanJordanKazakhstanKenyaKoreaKuwaitLaosLatin AmericaLatviaLebanonLiberiaLithuaniaMalaysiaMexicoMicronesiaMiddle AfricaMoldovaMoroccoNepalNetherlandsNicaraguaNigeriaNorth AmericaNorth MacedoniaNorthern AfricaNorthern EuropeNorwayOceaniaPakistanPanamaPeruPhilippinesPolandPortugalRomaniaRussiaSaudi ArabiaScotlandSenegalSerbiaSierra LeoneSingaporeSomaliaSouth AfricaSouth AmericaSouth Central AsiaSouth Eastern AsiaSouthern EuropeSpainSri LankaSt. Vincent and the GrenadinesSudanSwedenSwitzerlandSyriaTaiwanThailandTrinidad and TobagoTurkeyUgandaUkraineUruguayUzbekistanVenezuelaVietnamWest IndiesWestern AfricaWestern AsiaWestern EuropeYemenZaireZimbabweAzores
Self-Care Disability
Income
Poverty
Unemployment
Labor Participation
Family Structure
Vehicle Availability
Education Level
Disability

Eastern European Self-Care Disability
Exceptional

2.3%
SELF-CARE DISABILITY
99.2/ 100
METRIC RATING
72nd/ 347
METRIC RANK

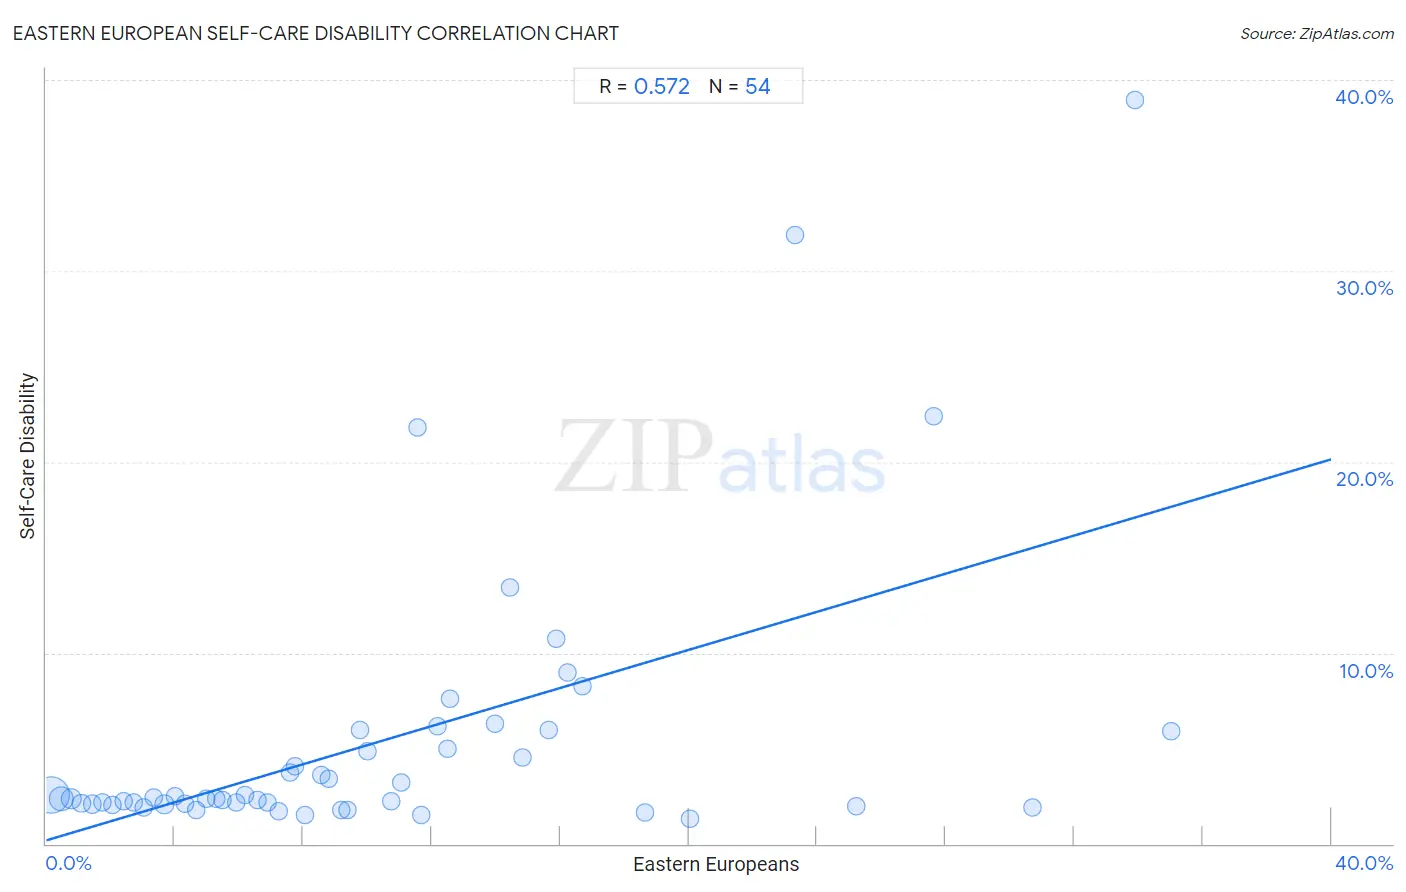
Eastern European Self-Care Disability Correlation Chart

The statistical analysis conducted on geographies consisting of 460,402,865 people shows a substantial positive correlation between the proportion of Eastern Europeans and percentage of population with self-care disability in the United States with a correlation coefficient (R) of 0.572 and weighted average of 2.3%. On average, for every 1% (one percent) increase in Eastern Europeans within a typical geography, there is an increase of 0.50% in percentage of population with self-care disability.
Eastern European Self-Care Disability
It is essential to understand that the correlation between the percentage of Eastern Europeans and percentage of population with self-care disability does not imply a direct cause-and-effect relationship. It remains uncertain whether the presence of Eastern Europeans influences an upward or downward trend in the level of percentage of population with self-care disability within an area, or if Eastern Europeans simply ended up residing in those areas with higher or lower levels of percentage of population with self-care disability due to other factors.

Demographics Similar to Eastern Europeans by Self-Care Disability

In terms of self-care disability, the demographic groups most similar to Eastern Europeans are Asian (2.3%, a difference of 0.030%), Immigrants from Egypt (2.3%, a difference of 0.030%), Immigrants from Northern Europe (2.3%, a difference of 0.070%), Immigrants from Switzerland (2.3%, a difference of 0.090%), and Immigrants from Zaire (2.3%, a difference of 0.10%).
DemographicsRating | RankSelf-Care Disability
Brazilians
99.3
/100
|
#65
Exceptional
2.3%
Immigrants from Argentina
99.3
/100
|
#66
Exceptional
2.3%
South Africans
99.3
/100
|
#67
Exceptional
2.3%
Immigrants from Zaire
99.2
/100
|
#68
Exceptional
2.3%
Immigrants from Norway
99.2
/100
|
#69
Exceptional
2.3%
Immigrants from Northern Europe
99.2
/100
|
#70
Exceptional
2.3%
Asians
99.2
/100
|
#71
Exceptional
2.3%
Eastern Europeans
99.2
/100
|
#72
Exceptional
2.3%
Immigrants from Egypt
99.1
/100
|
#73
Exceptional
2.3%
Immigrants from Switzerland
99.1
/100
|
#74
Exceptional
2.3%
Immigrants from Netherlands
99.1
/100
|
#75
Exceptional
2.3%
Immigrants from China
99.1
/100
|
#76
Exceptional
2.3%
Immigrants from Middle Africa
99.0
/100
|
#77
Exceptional
2.3%
Immigrants from Ireland
99.0
/100
|
#78
Exceptional
2.3%
Immigrants from Kenya
99.0
/100
|
#79
Exceptional
2.3%

Eastern European Self-Care Disability Correlation Summary

MeasurementEastern European DataSelf-Care Disability Data
Minimum0.14%1.3%
Maximum35.0%39.0%
Range34.9%37.7%
Mean10.5%5.4%
Median8.7%2.4%
Interquartile 25% (IQ1)4.3%2.1%
Interquartile 75% (IQ3)14.4%5.9%
Interquartile Range (IQR)10.1%3.8%
Standard Deviation (Sample)8.4%7.4%
Standard Deviation (Population)8.4%7.3%

Correlation Details

Eastern European PercentileSample SizeSelf-Care Disability
[
0.0%
-
0.5%
]
0.14%
292,082,1402.6%
[
0.0%
-
0.5%
]
0.45%
95,629,2532.3%
[
0.5%
-
1.0%
]
0.79%
37,568,9972.3%
[
1.0%
-
1.5%
]
1.09%
14,892,4212.1%
[
1.0%
-
1.5%
]
1.43%
6,817,4292.1%
[
1.5%
-
2.0%
]
1.75%
3,905,5462.2%
[
2.0%
-
2.5%
]
2.07%
2,397,2752.0%
[
2.0%
-
2.5%
]
2.40%
1,926,1812.3%
[
2.5%
-
3.0%
]
2.72%
1,138,1152.1%
[
3.0%
-
3.5%
]
3.03%
911,0951.9%
[
3.0%
-
3.5%
]
3.35%
488,7582.4%
[
3.5%
-
4.0%
]
3.68%
641,8342.1%
[
3.5%
-
4.0%
]
4.00%
284,5192.5%
[
4.0%
-
4.5%
]
4.30%
519,5392.1%
[
4.5%
-
5.0%
]
4.67%
255,4151.8%
[
4.5%
-
5.0%
]
4.98%
150,6212.4%
[
5.0%
-
5.5%
]
5.31%
212,6642.4%
[
5.5%
-
6.0%
]
5.50%
205,0422.3%
[
5.5%
-
6.0%
]
5.92%
127,1212.2%
[
6.0%
-
6.5%
]
6.20%
28,0262.6%
[
6.5%
-
7.0%
]
6.57%
3,0302.3%
[
6.5%
-
7.0%
]
6.89%
34,2992.1%
[
7.0%
-
7.5%
]
7.23%
28,2871.7%
[
7.5%
-
8.0%
]
7.60%
10,3943.7%
[
7.5%
-
8.0%
]
7.75%
35,7644.1%
[
8.0%
-
8.5%
]
8.06%
25,8391.5%
[
8.5%
-
9.0%
]
8.57%
30,7783.6%
[
8.5%
-
9.0%
]
8.78%
3,8383.4%
[
9.0%
-
9.5%
]
9.17%
14,0201.8%
[
9.0%
-
9.5%
]
9.38%
7,7941.8%
[
9.5%
-
10.0%
]
9.76%
3,1775.9%
[
10.0%
-
10.5%
]
10.01%
3,9384.8%
[
10.5%
-
11.0%
]
10.74%
2,7372.2%
[
11.0%
-
11.5%
]
11.04%
4,0493.2%
[
11.5%
-
12.0%
]
11.54%
7821.8%
[
11.5%
-
12.0%
]
11.66%
2,8551.5%
[
12.0%
-
12.5%
]
12.17%
3456.2%
[
12.0%
-
12.5%
]
12.50%
405.0%
[
12.5%
-
13.0%
]
12.56%
1,4177.6%
[
13.5%
-
14.0%
]
13.95%
3876.3%
[
14.0%
-
14.5%
]
14.43%
9713.4%
[
14.5%
-
15.0%
]
14.81%
1,3504.5%
[
15.5%
-
16.0%
]
15.62%
1606.0%
[
15.5%
-
16.0%
]
15.87%
77510.7%
[
16.0%
-
16.5%
]
16.24%
3889.0%
[
16.5%
-
17.0%
]
16.69%
5998.3%
[
18.5%
-
19.0%
]
18.63%
2,7101.7%
[
20.0%
-
20.5%
]
20.04%
4841.3%
[
23.0%
-
23.5%
]
23.31%
16331.9%
[
25.0%
-
25.5%
]
25.20%
6112.0%
[
27.5%
-
28.0%
]
27.63%
7622.4%
[
30.5%
-
31.0%
]
30.70%
3161.9%
[
33.5%
-
34.0%
]
33.90%
5939.0%
[
35.0%
-
35.5%
]
35.00%
205.9%