Czechoslovakian Disability
COMPARE
Czechoslovakian
Select to Compare
Disability
Czechoslovakian Disability
12.5%
DISABILITY
0.2/ 100
METRIC RATING
266th/ 347
METRIC RANK
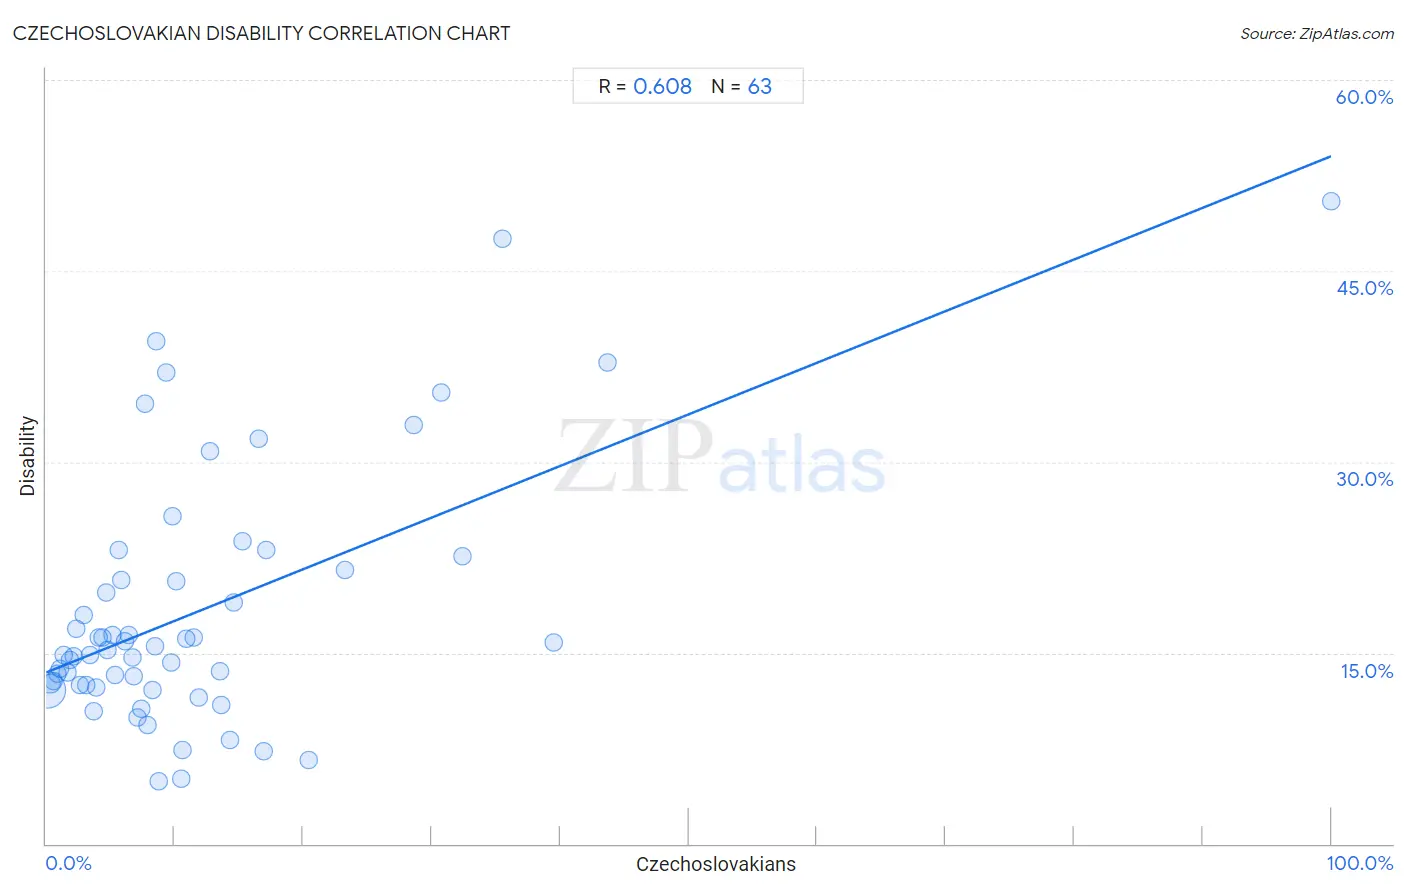
Czechoslovakian Disability Correlation Chart
The statistical analysis conducted on geographies consisting of 368,659,957 people shows a significant positive correlation between the proportion of Czechoslovakians and percentage of population with a disability in the United States with a correlation coefficient (R) of 0.608 and weighted average of 12.5%. On average, for every 1% (one percent) increase in Czechoslovakians within a typical geography, there is an increase of 0.41% in percentage of population with a disability.
It is essential to understand that the correlation between the percentage of Czechoslovakians and percentage of population with a disability does not imply a direct cause-and-effect relationship. It remains uncertain whether the presence of Czechoslovakians influences an upward or downward trend in the level of percentage of population with a disability within an area, or if Czechoslovakians simply ended up residing in those areas with higher or lower levels of percentage of population with a disability due to other factors.
Demographics Similar to Czechoslovakians by Disability
In terms of disability, the demographic groups most similar to Czechoslovakians are Spaniard (12.5%, a difference of 0.070%), U.S. Virgin Islander (12.5%, a difference of 0.16%), Immigrants from Germany (12.5%, a difference of 0.18%), Hawaiian (12.5%, a difference of 0.29%), and Bangladeshi (12.6%, a difference of 0.40%).
| Demographics | Rating | Rank | Disability |
| Canadians | 0.4 /100 | #259 | Tragic 12.4% |
| Immigrants from Liberia | 0.4 /100 | #260 | Tragic 12.4% |
| Scandinavians | 0.4 /100 | #261 | Tragic 12.4% |
| Native Hawaiians | 0.3 /100 | #262 | Tragic 12.5% |
| Hawaiians | 0.2 /100 | #263 | Tragic 12.5% |
| Immigrants from Germany | 0.2 /100 | #264 | Tragic 12.5% |
| U.S. Virgin Islanders | 0.2 /100 | #265 | Tragic 12.5% |
| Czechoslovakians | 0.2 /100 | #266 | Tragic 12.5% |
| Spaniards | 0.2 /100 | #267 | Tragic 12.5% |
| Bangladeshis | 0.1 /100 | #268 | Tragic 12.6% |
| Immigrants from Dominican Republic | 0.1 /100 | #269 | Tragic 12.6% |
| Portuguese | 0.1 /100 | #270 | Tragic 12.6% |
| Immigrants from Yemen | 0.1 /100 | #271 | Tragic 12.6% |
| Dominicans | 0.0 /100 | #272 | Tragic 12.7% |
| Finns | 0.0 /100 | #273 | Tragic 12.7% |
Czechoslovakian Disability Correlation Summary
| Measurement | Czechoslovakian Data | Disability Data |
| Minimum | 0.078% | 5.0% |
| Maximum | 100.0% | 50.5% |
| Range | 99.9% | 45.5% |
| Mean | 11.8% | 18.3% |
| Median | 7.8% | 15.2% |
| Interquartile 25% (IQ1) | 3.9% | 12.5% |
| Interquartile 75% (IQ3) | 13.6% | 21.6% |
| Interquartile Range (IQR) | 9.7% | 9.0% |
| Standard Deviation (Sample) | 14.9% | 9.9% |
| Standard Deviation (Population) | 14.7% | 9.8% |
Correlation Details
| Czechoslovakian Percentile | Sample Size | Disability |
[ 0.0% - 0.5% ] 0.078% | 329,750,427 | 12.1% |
[ 0.0% - 0.5% ] 0.34% | 28,376,917 | 12.6% |
[ 0.5% - 1.0% ] 0.60% | 6,543,779 | 12.8% |
[ 0.5% - 1.0% ] 0.85% | 2,025,473 | 13.4% |
[ 1.0% - 1.5% ] 1.11% | 729,978 | 13.8% |
[ 1.0% - 1.5% ] 1.36% | 489,599 | 14.8% |
[ 1.5% - 2.0% ] 1.61% | 253,560 | 13.5% |
[ 1.5% - 2.0% ] 1.88% | 135,902 | 14.4% |
[ 2.0% - 2.5% ] 2.12% | 51,485 | 14.7% |
[ 2.0% - 2.5% ] 2.37% | 39,559 | 16.9% |
[ 2.5% - 3.0% ] 2.58% | 54,545 | 12.5% |
[ 2.5% - 3.0% ] 2.90% | 34,585 | 18.0% |
[ 3.0% - 3.5% ] 3.09% | 23,303 | 12.5% |
[ 3.0% - 3.5% ] 3.41% | 28,278 | 14.8% |
[ 3.5% - 4.0% ] 3.66% | 23,021 | 10.4% |
[ 3.5% - 4.0% ] 3.93% | 12,327 | 12.2% |
[ 4.0% - 4.5% ] 4.09% | 14,705 | 16.2% |
[ 4.0% - 4.5% ] 4.37% | 10,975 | 16.2% |
[ 4.5% - 5.0% ] 4.66% | 3,714 | 19.7% |
[ 4.5% - 5.0% ] 4.80% | 4,644 | 15.2% |
[ 5.0% - 5.5% ] 5.16% | 6,916 | 16.4% |
[ 5.0% - 5.5% ] 5.34% | 4,061 | 13.3% |
[ 5.5% - 6.0% ] 5.63% | 3,607 | 23.0% |
[ 5.5% - 6.0% ] 5.80% | 1,984 | 20.7% |
[ 6.0% - 6.5% ] 6.16% | 276 | 15.9% |
[ 6.0% - 6.5% ] 6.43% | 3,872 | 16.4% |
[ 6.5% - 7.0% ] 6.71% | 6,197 | 14.6% |
[ 6.5% - 7.0% ] 6.79% | 1,722 | 13.2% |
[ 7.0% - 7.5% ] 7.11% | 211 | 10.0% |
[ 7.0% - 7.5% ] 7.35% | 136 | 10.6% |
[ 7.5% - 8.0% ] 7.69% | 52 | 34.6% |
[ 7.5% - 8.0% ] 7.83% | 4,174 | 9.3% |
[ 8.0% - 8.5% ] 8.24% | 340 | 12.1% |
[ 8.0% - 8.5% ] 8.48% | 2,075 | 15.5% |
[ 8.5% - 9.0% ] 8.52% | 223 | 39.5% |
[ 8.5% - 9.0% ] 8.76% | 605 | 5.0% |
[ 9.0% - 9.5% ] 9.35% | 278 | 37.1% |
[ 9.5% - 10.0% ] 9.74% | 154 | 14.3% |
[ 9.5% - 10.0% ] 9.78% | 1,544 | 25.8% |
[ 10.0% - 10.5% ] 10.08% | 1,418 | 20.7% |
[ 10.0% - 10.5% ] 10.50% | 1,810 | 5.1% |
[ 10.5% - 11.0% ] 10.57% | 246 | 7.3% |
[ 10.5% - 11.0% ] 10.90% | 688 | 16.1% |
[ 11.0% - 11.5% ] 11.43% | 1,531 | 16.2% |
[ 11.5% - 12.0% ] 11.86% | 2,175 | 11.5% |
[ 12.5% - 13.0% ] 12.77% | 376 | 30.9% |
[ 13.0% - 13.5% ] 13.50% | 526 | 13.5% |
[ 13.5% - 14.0% ] 13.64% | 110 | 10.9% |
[ 14.0% - 14.5% ] 14.29% | 588 | 8.2% |
[ 14.5% - 15.0% ] 14.59% | 1,775 | 19.0% |
[ 15.0% - 15.5% ] 15.25% | 59 | 23.7% |
[ 16.5% - 17.0% ] 16.56% | 151 | 31.8% |
[ 16.5% - 17.0% ] 16.92% | 591 | 7.3% |
[ 17.0% - 17.5% ] 17.09% | 515 | 23.1% |
[ 20.0% - 20.5% ] 20.45% | 489 | 6.5% |
[ 23.0% - 23.5% ] 23.28% | 116 | 21.6% |
[ 28.5% - 29.0% ] 28.57% | 504 | 32.9% |
[ 30.5% - 31.0% ] 30.77% | 468 | 35.5% |
[ 32.0% - 32.5% ] 32.42% | 219 | 22.6% |
[ 35.0% - 35.5% ] 35.46% | 141 | 47.5% |
[ 39.0% - 39.5% ] 39.47% | 38 | 15.8% |
[ 43.5% - 44.0% ] 43.70% | 119 | 37.8% |
[ 99.5% - 100.0% ] 100.00% | 101 | 50.5% |