Czechoslovakian Self-Care Disability
COMPARE
Czechoslovakian
Select to Compare
Self-Care Disability
Czechoslovakian Self-Care Disability
2.5%
SELF-CARE DISABILITY
53.5/ 100
METRIC RATING
172nd/ 347
METRIC RANK
Czechoslovakian Self-Care Disability Correlation Chart
The statistical analysis conducted on geographies consisting of 368,314,716 people shows a mild positive correlation between the proportion of Czechoslovakians and percentage of population with self-care disability in the United States with a correlation coefficient (R) of 0.341 and weighted average of 2.5%. On average, for every 1% (one percent) increase in Czechoslovakians within a typical geography, there is an increase of 0.14% in percentage of population with self-care disability.
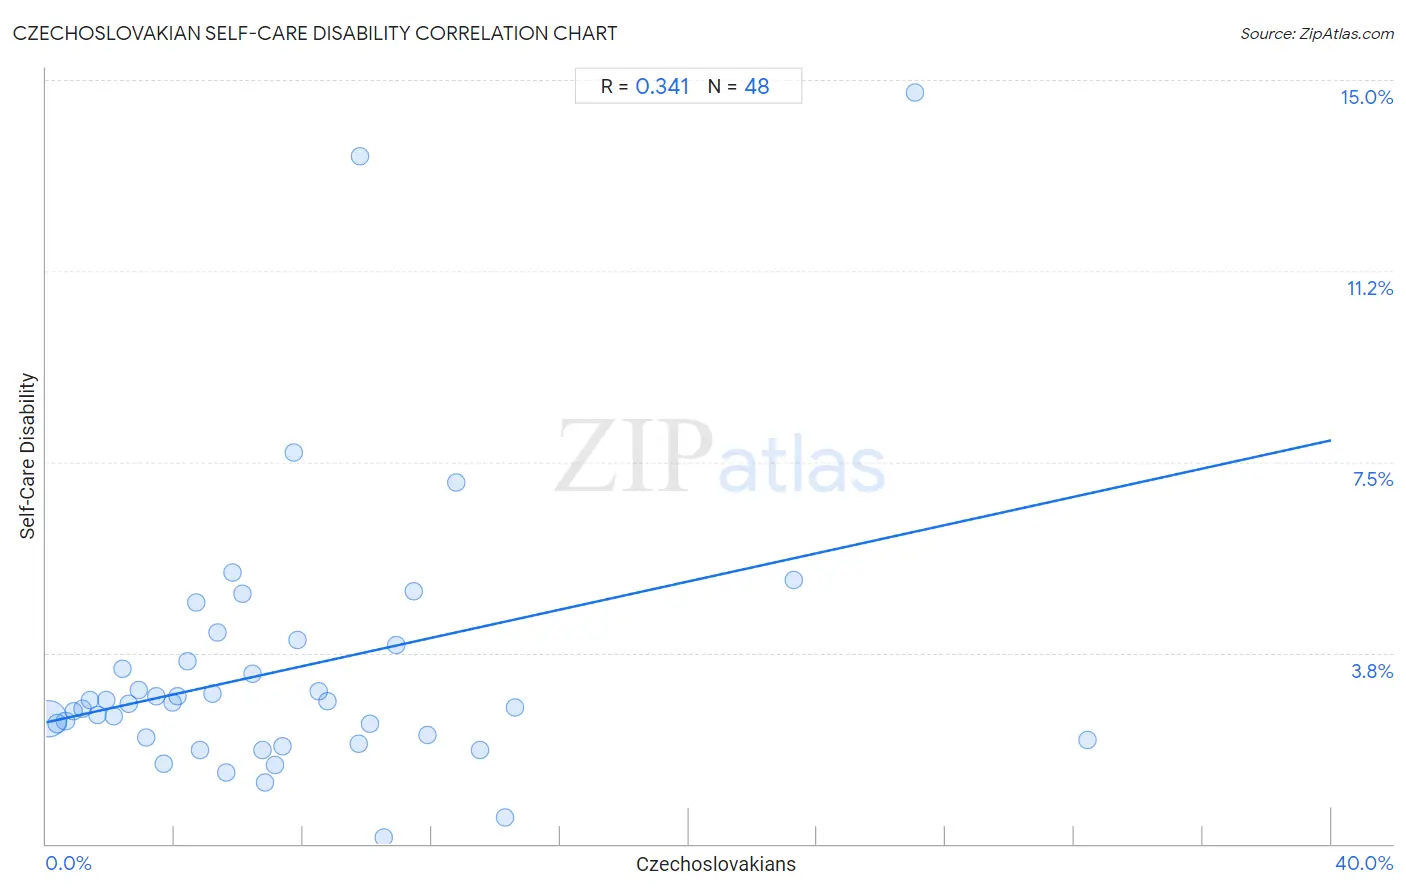
It is essential to understand that the correlation between the percentage of Czechoslovakians and percentage of population with self-care disability does not imply a direct cause-and-effect relationship. It remains uncertain whether the presence of Czechoslovakians influences an upward or downward trend in the level of percentage of population with self-care disability within an area, or if Czechoslovakians simply ended up residing in those areas with higher or lower levels of percentage of population with self-care disability due to other factors.
Demographics Similar to Czechoslovakians by Self-Care Disability
In terms of self-care disability, the demographic groups most similar to Czechoslovakians are Pennsylvania German (2.5%, a difference of 0.0%), Immigrants from Burma/Myanmar (2.5%, a difference of 0.030%), Scottish (2.5%, a difference of 0.040%), Immigrants from Somalia (2.5%, a difference of 0.12%), and Welsh (2.5%, a difference of 0.17%).
| Demographics | Rating | Rank | Self-Care Disability |
| Syrians | 59.0 /100 | #165 | Average 2.5% |
| Canadians | 58.8 /100 | #166 | Average 2.5% |
| Immigrants from Greece | 57.3 /100 | #167 | Average 2.5% |
| Ute | 57.1 /100 | #168 | Average 2.5% |
| Immigrants from Somalia | 55.9 /100 | #169 | Average 2.5% |
| Scottish | 54.3 /100 | #170 | Average 2.5% |
| Pennsylvania Germans | 53.5 /100 | #171 | Average 2.5% |
| Czechoslovakians | 53.5 /100 | #172 | Average 2.5% |
| Immigrants from Burma/Myanmar | 52.8 /100 | #173 | Average 2.5% |
| Welsh | 50.0 /100 | #174 | Average 2.5% |
| Immigrants from Bosnia and Herzegovina | 49.6 /100 | #175 | Average 2.5% |
| Immigrants from Afghanistan | 47.6 /100 | #176 | Average 2.5% |
| Immigrants from Kazakhstan | 46.7 /100 | #177 | Average 2.5% |
| English | 46.2 /100 | #178 | Average 2.5% |
| Hungarians | 45.5 /100 | #179 | Average 2.5% |
Czechoslovakian Self-Care Disability Correlation Summary
| Measurement | Czechoslovakian Data | Self-Care Disability Data |
| Minimum | 0.078% | 0.12% |
| Maximum | 32.4% | 14.8% |
| Range | 32.3% | 14.6% |
| Mean | 7.4% | 3.4% |
| Median | 5.9% | 2.8% |
| Interquartile 25% (IQ1) | 3.0% | 2.1% |
| Interquartile 75% (IQ3) | 9.9% | 3.7% |
| Interquartile Range (IQR) | 6.9% | 1.7% |
| Standard Deviation (Sample) | 6.6% | 2.7% |
| Standard Deviation (Population) | 6.5% | 2.7% |
Correlation Details
| Czechoslovakian Percentile | Sample Size | Self-Care Disability |
[ 0.0% - 0.5% ] 0.078% | 329,613,490 | 2.5% |
[ 0.0% - 0.5% ] 0.34% | 28,291,391 | 2.4% |
[ 0.5% - 1.0% ] 0.60% | 6,506,812 | 2.4% |
[ 0.5% - 1.0% ] 0.85% | 2,002,943 | 2.6% |
[ 1.0% - 1.5% ] 1.11% | 716,235 | 2.6% |
[ 1.0% - 1.5% ] 1.36% | 484,418 | 2.8% |
[ 1.5% - 2.0% ] 1.61% | 246,099 | 2.5% |
[ 1.5% - 2.0% ] 1.88% | 129,188 | 2.8% |
[ 2.0% - 2.5% ] 2.11% | 46,302 | 2.5% |
[ 2.0% - 2.5% ] 2.37% | 38,629 | 3.4% |
[ 2.5% - 3.0% ] 2.58% | 51,591 | 2.8% |
[ 2.5% - 3.0% ] 2.90% | 33,764 | 3.0% |
[ 3.0% - 3.5% ] 3.10% | 18,803 | 2.1% |
[ 3.0% - 3.5% ] 3.41% | 26,988 | 2.9% |
[ 3.5% - 4.0% ] 3.66% | 22,205 | 1.6% |
[ 3.5% - 4.0% ] 3.94% | 11,221 | 2.8% |
[ 4.0% - 4.5% ] 4.09% | 14,360 | 2.9% |
[ 4.0% - 4.5% ] 4.39% | 6,329 | 3.6% |
[ 4.5% - 5.0% ] 4.66% | 3,586 | 4.7% |
[ 4.5% - 5.0% ] 4.80% | 4,459 | 1.8% |
[ 5.0% - 5.5% ] 5.16% | 6,644 | 2.9% |
[ 5.0% - 5.5% ] 5.32% | 3,345 | 4.1% |
[ 5.5% - 6.0% ] 5.62% | 3,006 | 1.4% |
[ 5.5% - 6.0% ] 5.79% | 1,917 | 5.3% |
[ 6.0% - 6.5% ] 6.10% | 164 | 4.9% |
[ 6.0% - 6.5% ] 6.43% | 3,423 | 3.3% |
[ 6.5% - 7.0% ] 6.72% | 5,926 | 1.8% |
[ 6.5% - 7.0% ] 6.79% | 1,722 | 1.2% |
[ 7.0% - 7.5% ] 7.11% | 211 | 1.5% |
[ 7.0% - 7.5% ] 7.34% | 109 | 1.9% |
[ 7.5% - 8.0% ] 7.69% | 52 | 7.7% |
[ 7.5% - 8.0% ] 7.84% | 3,930 | 4.0% |
[ 8.0% - 8.5% ] 8.48% | 1,886 | 3.0% |
[ 8.5% - 9.0% ] 8.76% | 605 | 2.8% |
[ 9.5% - 10.0% ] 9.74% | 154 | 2.0% |
[ 9.5% - 10.0% ] 9.78% | 1,544 | 13.5% |
[ 10.0% - 10.5% ] 10.08% | 1,418 | 2.4% |
[ 10.0% - 10.5% ] 10.50% | 1,810 | 0.12% |
[ 10.5% - 11.0% ] 10.90% | 688 | 3.9% |
[ 11.0% - 11.5% ] 11.43% | 1,452 | 5.0% |
[ 11.5% - 12.0% ] 11.86% | 2,175 | 2.1% |
[ 12.5% - 13.0% ] 12.77% | 376 | 7.1% |
[ 13.0% - 13.5% ] 13.50% | 526 | 1.9% |
[ 14.0% - 14.5% ] 14.29% | 588 | 0.51% |
[ 14.5% - 15.0% ] 14.59% | 1,775 | 2.7% |
[ 23.0% - 23.5% ] 23.28% | 116 | 5.2% |
[ 27.0% - 27.5% ] 27.05% | 122 | 14.8% |
[ 32.0% - 32.5% ] 32.42% | 219 | 2.0% |