Chinese Unemployment Among Women with Children Ages 6 to 17 years

COMPARE

Chinese
Race
Ancestry
AfghanAfricanAlaska NativeAlaskan AthabascanAlbanianAleutAlsatianAmericanApacheArabArapahoArgentineanArmenianAssyrian/Chaldean/SyriacAustralianAustrianBahamianBangladeshiBarbadianBasqueBelgianBelizeanBermudanBhutaneseBlackfeetBolivianBrazilianBritishBritish West IndianBulgarianBurmeseCajunCambodianCanadianCape VerdeanCarpatho RusynCelticCentral AmericanCentral American IndianCherokeeCheyenneChickasawChileanChineseChippewaChoctawColombianColvilleComancheCosta RicanCreeCreekCroatianCrowCubanCypriotCzechCzechoslovakianDanishDelawareDominicanDutchDutch West IndianEastern EuropeanEcuadorianEgyptianEnglishEstonianEthiopianEuropeanFijianFilipinoFinnishFrenchFrench American IndianFrench CanadianGermanGerman RussianGhanaianGreekGuamanian/ChamorroGuatemalanGuyaneseHaitianHmongHonduranHopiHoumaHungarianIcelanderIndian (Asian)IndonesianInupiatIranianIraqiIrishIroquoisIsraeliItalianJamaicanJapaneseJordanianKenyanKiowaKoreanLaotianLatvianLebaneseLiberianLithuanianLumbeeLuxembourgerMacedonianMalaysianMalteseMarshalleseMenomineeMexicanMexican American IndianMongolianMoroccanNative HawaiianNavajoNepaleseNew ZealanderNicaraguanNigerianNorthern EuropeanNorwegianOkinawanOsageOttawaPaiutePakistaniPalestinianPanamanianParaguayanPennsylvania GermanPeruvianPimaPolishPortuguesePotawatomiPuebloPuerto RicanPuget Sound SalishRomanianRussianSalvadoranSamoanScandinavianScotch-IrishScottishSeminoleSenegaleseSerbianShoshoneSierra LeoneanSiouxSlavicSlovakSloveneSomaliSouth AfricanSouth AmericanSouth American IndianSoviet UnionSpaniardSpanishSpanish AmericanSpanish American IndianSri LankanSubsaharan AfricanSudaneseSwedishSwissSyrianTaiwaneseThaiTlingit-HaidaTohono O'OdhamTonganTrinidadian and TobagonianTsimshianTurkishU.S. Virgin IslanderUgandanUkrainianUruguayanUteVenezuelanVietnameseWelshWest IndianYakamaYaquiYugoslavianYumanYup'ikZimbabwean
Immigration
NonimmigrantsImmigrantsAfghanistanAfricaAlbaniaArgentinaArmeniaAsiaAustraliaAustriaBahamasBangladeshBarbadosBelarusBelgiumBelizeBoliviaBosnia and HerzegovinaBrazilBulgariaBurma/MyanmarCabo VerdeCambodiaCameroonCanadaCaribbeanCentral AmericaChileChinaColombiaCongoCosta RicaCroatiaCubaCzechoslovakiaDenmarkDominicaDominican RepublicEastern AfricaEastern AsiaEastern EuropeEcuadorEgyptEl SalvadorEnglandEritreaEthiopiaEuropeFijiFranceGermanyGhanaGreeceGrenadaGuatemalaGuyanaHaitiHondurasHong KongHungaryIndiaIndonesiaIranIraqIrelandIsraelItalyJamaicaJapanJordanKazakhstanKenyaKoreaKuwaitLaosLatin AmericaLatviaLebanonLiberiaLithuaniaMalaysiaMexicoMicronesiaMiddle AfricaMoldovaMoroccoNepalNetherlandsNicaraguaNigeriaNorth AmericaNorth MacedoniaNorthern AfricaNorthern EuropeNorwayOceaniaPakistanPanamaPeruPhilippinesPolandPortugalRomaniaRussiaSaudi ArabiaScotlandSenegalSerbiaSierra LeoneSingaporeSomaliaSouth AfricaSouth AmericaSouth Central AsiaSouth Eastern AsiaSouthern EuropeSpainSri LankaSt. Vincent and the GrenadinesSudanSwedenSwitzerlandSyriaTaiwanThailandTrinidad and TobagoTurkeyUgandaUkraineUruguayUzbekistanVenezuelaVietnamWest IndiesWestern AfricaWestern AsiaWestern EuropeYemenZaireZimbabweAzores
Select to Compare
Race
Ancestry
AfghanAfricanAlaska NativeAlaskan AthabascanAlbanianAleutAlsatianAmericanApacheArabArapahoArgentineanArmenianAssyrian/Chaldean/SyriacAustralianAustrianBahamianBangladeshiBarbadianBasqueBelgianBelizeanBermudanBhutaneseBlackfeetBolivianBrazilianBritishBritish West IndianBulgarianBurmeseCajunCambodianCanadianCape VerdeanCarpatho RusynCelticCentral AmericanCentral American IndianCherokeeCheyenneChickasawChileanChippewaChoctawColombianColvilleComancheCosta RicanCreeCreekCroatianCrowCubanCypriotCzechCzechoslovakianDanishDelawareDominicanDutchDutch West IndianEastern EuropeanEcuadorianEgyptianEnglishEstonianEthiopianEuropeanFijianFilipinoFinnishFrenchFrench American IndianFrench CanadianGermanGerman RussianGhanaianGreekGuamanian/ChamorroGuatemalanGuyaneseHaitianHmongHonduranHopiHoumaHungarianIcelanderIndian (Asian)IndonesianInupiatIranianIraqiIrishIroquoisIsraeliItalianJamaicanJapaneseJordanianKenyanKiowaKoreanLaotianLatvianLebaneseLiberianLithuanianLumbeeLuxembourgerMacedonianMalaysianMalteseMarshalleseMenomineeMexicanMexican American IndianMongolianMoroccanNative HawaiianNavajoNepaleseNew ZealanderNicaraguanNigerianNorthern EuropeanNorwegianOkinawanOsageOttawaPaiutePakistaniPalestinianPanamanianParaguayanPennsylvania GermanPeruvianPimaPolishPortuguesePotawatomiPuebloPuerto RicanPuget Sound SalishRomanianRussianSalvadoranSamoanScandinavianScotch-IrishScottishSeminoleSenegaleseSerbianShoshoneSierra LeoneanSiouxSlavicSlovakSloveneSomaliSouth AfricanSouth AmericanSouth American IndianSoviet UnionSpaniardSpanishSpanish AmericanSpanish American IndianSri LankanSubsaharan AfricanSudaneseSwedishSwissSyrianTaiwaneseThaiTlingit-HaidaTohono O'OdhamTonganTrinidadian and TobagonianTsimshianTurkishU.S. Virgin IslanderUgandanUkrainianUruguayanUteVenezuelanVietnameseWelshWest IndianYakamaYaquiYugoslavianYumanYup'ikZimbabwean
Immigration
NonimmigrantsImmigrantsAfghanistanAfricaAlbaniaArgentinaArmeniaAsiaAustraliaAustriaBahamasBangladeshBarbadosBelarusBelgiumBelizeBoliviaBosnia and HerzegovinaBrazilBulgariaBurma/MyanmarCabo VerdeCambodiaCameroonCanadaCaribbeanCentral AmericaChileChinaColombiaCongoCosta RicaCroatiaCubaCzechoslovakiaDenmarkDominicaDominican RepublicEastern AfricaEastern AsiaEastern EuropeEcuadorEgyptEl SalvadorEnglandEritreaEthiopiaEuropeFijiFranceGermanyGhanaGreeceGrenadaGuatemalaGuyanaHaitiHondurasHong KongHungaryIndiaIndonesiaIranIraqIrelandIsraelItalyJamaicaJapanJordanKazakhstanKenyaKoreaKuwaitLaosLatin AmericaLatviaLebanonLiberiaLithuaniaMalaysiaMexicoMicronesiaMiddle AfricaMoldovaMoroccoNepalNetherlandsNicaraguaNigeriaNorth AmericaNorth MacedoniaNorthern AfricaNorthern EuropeNorwayOceaniaPakistanPanamaPeruPhilippinesPolandPortugalRomaniaRussiaSaudi ArabiaScotlandSenegalSerbiaSierra LeoneSingaporeSomaliaSouth AfricaSouth AmericaSouth Central AsiaSouth Eastern AsiaSouthern EuropeSpainSri LankaSt. Vincent and the GrenadinesSudanSwedenSwitzerlandSyriaTaiwanThailandTrinidad and TobagoTurkeyUgandaUkraineUruguayUzbekistanVenezuelaVietnamWest IndiesWestern AfricaWestern AsiaWestern EuropeYemenZaireZimbabweAzores
Unemployment Among Women with Children Ages 6 to 17 years
Income
Poverty
Unemployment
Labor Participation
Family Structure
Vehicle Availability
Education Level
Disability

Chinese Unemployment Among Women with Children Ages 6 to 17 years
Tragic

9.3%
UNEMPLOYMENT | WOMEN W/ CHILDREN 6 TO 17
5.2/ 100
METRIC RATING
225th/ 347
METRIC RANK

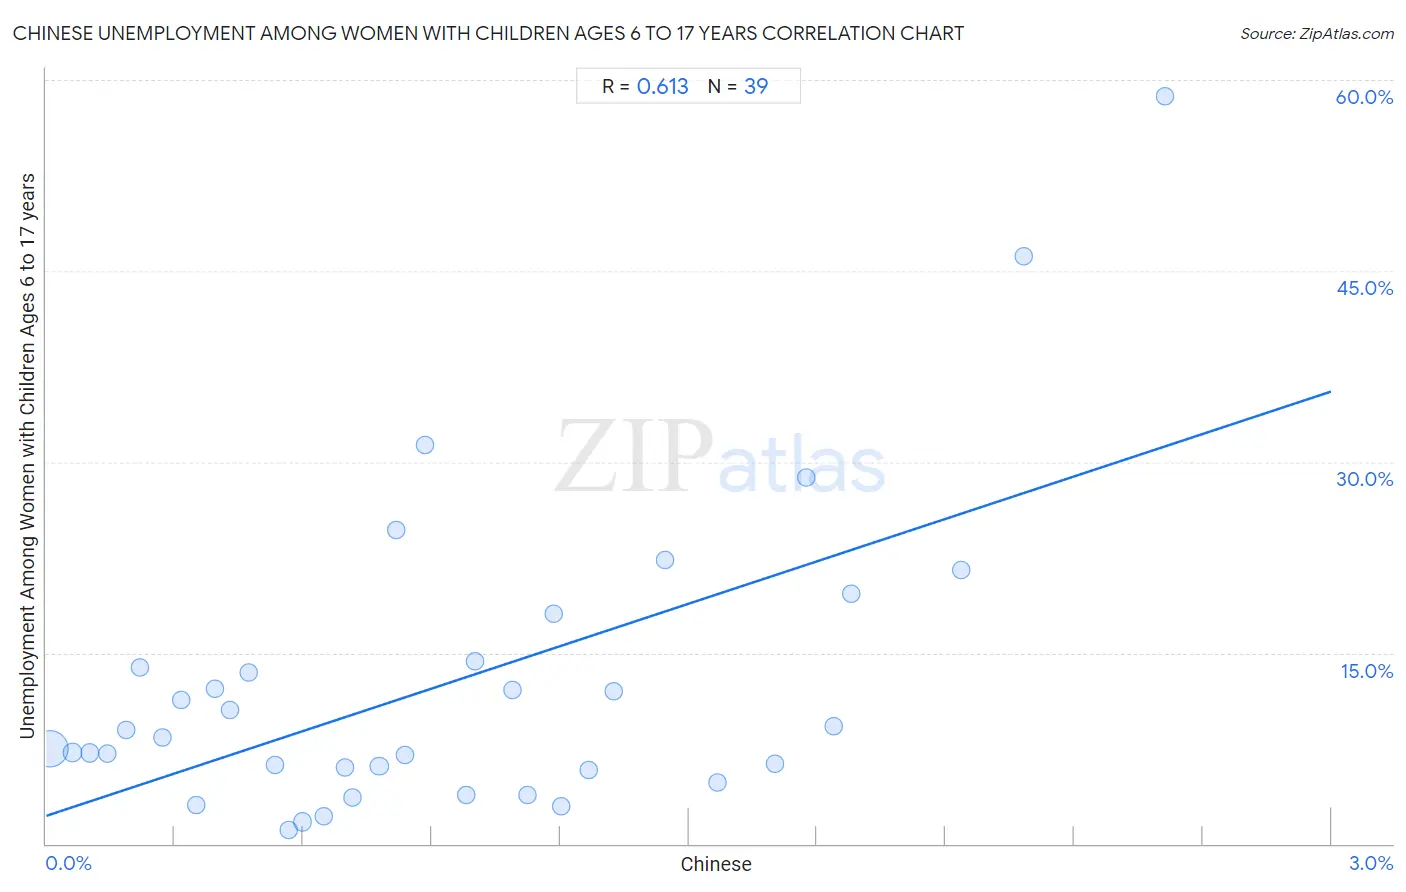
Chinese Unemployment Among Women with Children Ages 6 to 17 years Correlation Chart

The statistical analysis conducted on geographies consisting of 57,778,036 people shows a significant positive correlation between the proportion of Chinese and unemployment rate among women with children between the ages 6 and 17 in the United States with a correlation coefficient (R) of 0.613 and weighted average of 9.3%. On average, for every 1% (one percent) increase in Chinese within a typical geography, there is an increase of 11.1% in unemployment rate among women with children between the ages 6 and 17.
Chinese Unemployment Among Women with Children Ages 6 to 17 years
It is essential to understand that the correlation between the percentage of Chinese and unemployment rate among women with children between the ages 6 and 17 does not imply a direct cause-and-effect relationship. It remains uncertain whether the presence of Chinese influences an upward or downward trend in the level of unemployment rate among women with children between the ages 6 and 17 within an area, or if Chinese simply ended up residing in those areas with higher or lower levels of unemployment rate among women with children between the ages 6 and 17 due to other factors.

Demographics Similar to Chinese by Unemployment Among Women with Children Ages 6 to 17 years

In terms of unemployment among women with children ages 6 to 17 years, the demographic groups most similar to Chinese are Immigrants from El Salvador (9.3%, a difference of 0.010%), Immigrants from Eritrea (9.2%, a difference of 0.11%), Immigrants from Southern Europe (9.2%, a difference of 0.12%), Crow (9.2%, a difference of 0.13%), and Immigrants from the Azores (9.3%, a difference of 0.14%).
DemographicsRating | RankUnemployment Among Women with Children Ages 6 to 17 years
Syrians
6.9
/100
|
#218
Tragic
9.2%
Immigrants from Scotland
6.6
/100
|
#219
Tragic
9.2%
Belgians
6.4
/100
|
#220
Tragic
9.2%
Crow
5.8
/100
|
#221
Tragic
9.2%
Immigrants from Southern Europe
5.8
/100
|
#222
Tragic
9.2%
Immigrants from Eritrea
5.8
/100
|
#223
Tragic
9.2%
Immigrants from El Salvador
5.3
/100
|
#224
Tragic
9.3%
Chinese
5.2
/100
|
#225
Tragic
9.3%
Immigrants from the Azores
4.6
/100
|
#226
Tragic
9.3%
Panamanians
4.5
/100
|
#227
Tragic
9.3%
Estonians
4.4
/100
|
#228
Tragic
9.3%
Lumbee
4.3
/100
|
#229
Tragic
9.3%
Welsh
4.0
/100
|
#230
Tragic
9.3%
Macedonians
3.9
/100
|
#231
Tragic
9.3%
French American Indians
3.7
/100
|
#232
Tragic
9.3%

Chinese Unemployment Among Women with Children Ages 6 to 17 years Correlation Summary

MeasurementChinese DataUnemployment Among Women with Children Ages 6 to 17 years Data
Minimum0.0080%1.1%
Maximum2.6%58.7%
Range2.6%57.6%
Mean0.93%12.6%
Median0.82%8.3%
Interquartile 25% (IQ1)0.39%5.8%
Interquartile 75% (IQ3)1.3%14.3%
Interquartile Range (IQR)0.93%8.5%
Standard Deviation (Sample)0.66%12.1%
Standard Deviation (Population)0.66%11.9%

Correlation Details

Chinese PercentileSample SizeUnemployment Among Women with Children Ages 6 to 17 years
[
0.0%
-
0.5%
]
0.0080%
50,226,5187.5%
[
0.0%
-
0.5%
]
0.061%
3,247,8387.2%
[
0.0%
-
0.5%
]
0.10%
979,7347.1%
[
0.0%
-
0.5%
]
0.14%
796,7377.0%
[
0.0%
-
0.5%
]
0.19%
213,7288.9%
[
0.0%
-
0.5%
]
0.22%
236,01113.8%
[
0.0%
-
0.5%
]
0.27%
155,5298.3%
[
0.0%
-
0.5%
]
0.31%
160,87811.3%
[
0.0%
-
0.5%
]
0.35%
32,9743.1%
[
0.0%
-
0.5%
]
0.39%
62,80812.2%
[
0.0%
-
0.5%
]
0.43%
67,30110.5%
[
0.0%
-
0.5%
]
0.47%
58,28813.5%
[
0.5%
-
1.0%
]
0.53%
54,9556.2%
[
0.5%
-
1.0%
]
0.56%
47,6271.1%
[
0.5%
-
1.0%
]
0.60%
168,4021.7%
[
0.5%
-
1.0%
]
0.65%
39,3422.2%
[
0.5%
-
1.0%
]
0.70%
104,4276.0%
[
0.5%
-
1.0%
]
0.71%
67,3253.7%
[
0.5%
-
1.0%
]
0.78%
436,3606.1%
[
0.5%
-
1.0%
]
0.82%
13,93224.6%
[
0.5%
-
1.0%
]
0.84%
92,8586.9%
[
0.5%
-
1.0%
]
0.89%
25,18031.3%
[
0.5%
-
1.0%
]
0.98%
40,3233.8%
[
1.0%
-
1.5%
]
1.00%
36,93114.3%
[
1.0%
-
1.5%
]
1.09%
14,41112.1%
[
1.0%
-
1.5%
]
1.12%
21,5463.8%
[
1.0%
-
1.5%
]
1.19%
13,91918.1%
[
1.0%
-
1.5%
]
1.20%
49,4912.9%
[
1.0%
-
1.5%
]
1.27%
54,3625.8%
[
1.0%
-
1.5%
]
1.33%
25,95712.0%
[
1.0%
-
1.5%
]
1.45%
45,03822.3%
[
1.5%
-
2.0%
]
1.57%
27,4234.8%
[
1.5%
-
2.0%
]
1.70%
18,8026.3%
[
1.5%
-
2.0%
]
1.77%
35,49328.8%
[
1.5%
-
2.0%
]
1.84%
41,5609.2%
[
1.5%
-
2.0%
]
1.88%
2,87219.6%
[
2.0%
-
2.5%
]
2.14%
55,88821.5%
[
2.0%
-
2.5%
]
2.28%
48246.2%
[
2.5%
-
3.0%
]
2.61%
4,78658.7%