Chinese College, 1 year or more
COMPARE
Chinese
Select to Compare
College, 1 year or more
Chinese College, 1 year or more
62.2%
COLLEGE, 1 YEAR OR MORE
97.2/ 100
METRIC RATING
96th/ 347
METRIC RANK
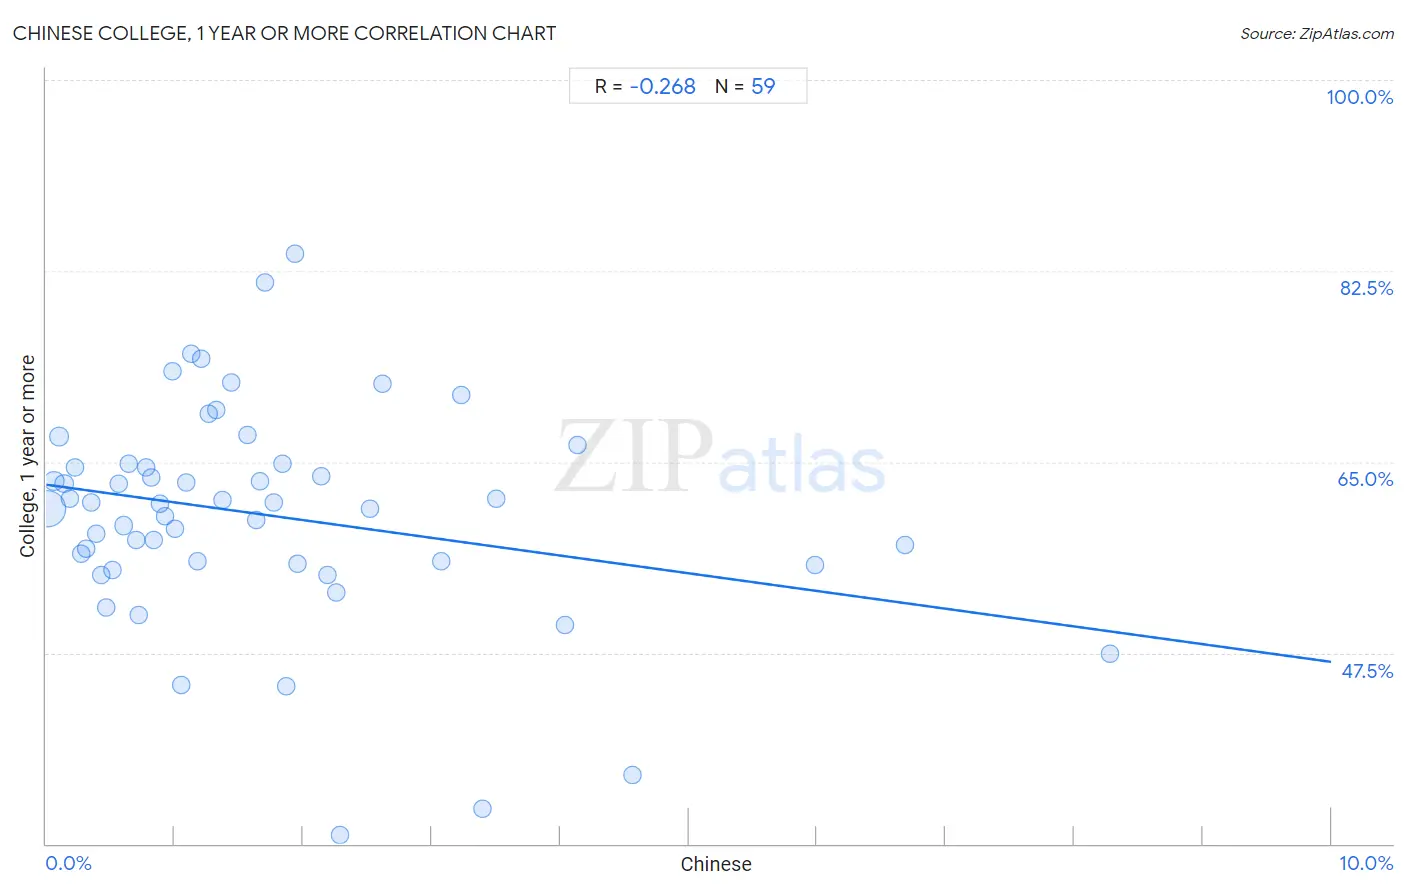
Chinese College, 1 year or more Correlation Chart
The statistical analysis conducted on geographies consisting of 64,809,883 people shows a weak negative correlation between the proportion of Chinese and percentage of population with at least college, 1 year or more education in the United States with a correlation coefficient (R) of -0.268 and weighted average of 62.2%. On average, for every 1% (one percent) increase in Chinese within a typical geography, there is a decrease of 1.6% in percentage of population with at least college, 1 year or more education.
It is essential to understand that the correlation between the percentage of Chinese and percentage of population with at least college, 1 year or more education does not imply a direct cause-and-effect relationship. It remains uncertain whether the presence of Chinese influences an upward or downward trend in the level of percentage of population with at least college, 1 year or more education within an area, or if Chinese simply ended up residing in those areas with higher or lower levels of percentage of population with at least college, 1 year or more education due to other factors.
Demographics Similar to Chinese by College, 1 year or more
In terms of college, 1 year or more, the demographic groups most similar to Chinese are Jordanian (62.2%, a difference of 0.010%), Carpatho Rusyn (62.2%, a difference of 0.010%), Croatian (62.2%, a difference of 0.010%), British (62.3%, a difference of 0.12%), and Icelander (62.1%, a difference of 0.17%).
| Demographics | Rating | Rank | College, 1 year or more |
| Immigrants from Ethiopia | 98.2 /100 | #89 | Exceptional 62.6% |
| Immigrants from Western Asia | 97.9 /100 | #90 | Exceptional 62.5% |
| Immigrants from Eastern Europe | 97.8 /100 | #91 | Exceptional 62.4% |
| Immigrants from Egypt | 97.8 /100 | #92 | Exceptional 62.4% |
| Romanians | 97.7 /100 | #93 | Exceptional 62.4% |
| Immigrants from Croatia | 97.6 /100 | #94 | Exceptional 62.3% |
| British | 97.4 /100 | #95 | Exceptional 62.3% |
| Chinese | 97.2 /100 | #96 | Exceptional 62.2% |
| Jordanians | 97.2 /100 | #97 | Exceptional 62.2% |
| Carpatho Rusyns | 97.2 /100 | #98 | Exceptional 62.2% |
| Croatians | 97.1 /100 | #99 | Exceptional 62.2% |
| Icelanders | 96.8 /100 | #100 | Exceptional 62.1% |
| Swedes | 96.8 /100 | #101 | Exceptional 62.1% |
| Luxembourgers | 96.7 /100 | #102 | Exceptional 62.1% |
| Afghans | 96.4 /100 | #103 | Exceptional 62.0% |
Chinese College, 1 year or more Correlation Summary
| Measurement | Chinese Data | College, 1 year or more Data |
| Minimum | 0.0087% | 30.8% |
| Maximum | 8.3% | 84.1% |
| Range | 8.3% | 53.3% |
| Mean | 1.7% | 60.1% |
| Median | 1.2% | 61.2% |
| Interquartile 25% (IQ1) | 0.60% | 55.6% |
| Interquartile 75% (IQ3) | 2.2% | 64.8% |
| Interquartile Range (IQR) | 1.6% | 9.1% |
| Standard Deviation (Sample) | 1.7% | 10.0% |
| Standard Deviation (Population) | 1.6% | 10.0% |
Correlation Details
| Chinese Percentile | Sample Size | College, 1 year or more |
[ 0.0% - 0.5% ] 0.0087% | 53,055,746 | 60.7% |
[ 0.0% - 0.5% ] 0.059% | 5,055,740 | 63.3% |
[ 0.0% - 0.5% ] 0.10% | 1,538,210 | 67.3% |
[ 0.0% - 0.5% ] 0.14% | 1,149,266 | 63.0% |
[ 0.0% - 0.5% ] 0.19% | 529,051 | 61.6% |
[ 0.0% - 0.5% ] 0.22% | 242,519 | 64.5% |
[ 0.0% - 0.5% ] 0.27% | 241,739 | 56.6% |
[ 0.0% - 0.5% ] 0.31% | 264,410 | 57.0% |
[ 0.0% - 0.5% ] 0.35% | 172,813 | 61.3% |
[ 0.0% - 0.5% ] 0.39% | 107,016 | 58.4% |
[ 0.0% - 0.5% ] 0.43% | 144,779 | 54.6% |
[ 0.0% - 0.5% ] 0.47% | 76,395 | 51.6% |
[ 0.5% - 1.0% ] 0.52% | 117,219 | 55.1% |
[ 0.5% - 1.0% ] 0.56% | 79,978 | 63.0% |
[ 0.5% - 1.0% ] 0.60% | 263,904 | 59.2% |
[ 0.5% - 1.0% ] 0.64% | 104,383 | 64.8% |
[ 0.5% - 1.0% ] 0.70% | 114,487 | 57.8% |
[ 0.5% - 1.0% ] 0.72% | 82,656 | 51.0% |
[ 0.5% - 1.0% ] 0.78% | 454,777 | 64.4% |
[ 0.5% - 1.0% ] 0.82% | 24,095 | 63.5% |
[ 0.5% - 1.0% ] 0.84% | 151,355 | 57.8% |
[ 0.5% - 1.0% ] 0.89% | 78,354 | 61.2% |
[ 0.5% - 1.0% ] 0.92% | 758 | 60.0% |
[ 0.5% - 1.0% ] 0.98% | 40,323 | 73.3% |
[ 1.0% - 1.5% ] 1.00% | 54,182 | 58.9% |
[ 1.0% - 1.5% ] 1.05% | 13,292 | 44.6% |
[ 1.0% - 1.5% ] 1.09% | 39,437 | 63.1% |
[ 1.0% - 1.5% ] 1.12% | 22,864 | 74.9% |
[ 1.0% - 1.5% ] 1.17% | 30,508 | 55.9% |
[ 1.0% - 1.5% ] 1.21% | 77,415 | 74.5% |
[ 1.0% - 1.5% ] 1.27% | 54,362 | 69.4% |
[ 1.0% - 1.5% ] 1.33% | 27,739 | 69.7% |
[ 1.0% - 1.5% ] 1.37% | 11,138 | 61.5% |
[ 1.0% - 1.5% ] 1.44% | 50,142 | 72.2% |
[ 1.5% - 2.0% ] 1.57% | 27,423 | 67.5% |
[ 1.5% - 2.0% ] 1.63% | 45,392 | 59.7% |
[ 1.5% - 2.0% ] 1.67% | 48,494 | 63.2% |
[ 1.5% - 2.0% ] 1.70% | 18,802 | 81.5% |
[ 1.5% - 2.0% ] 1.77% | 35,493 | 61.3% |
[ 1.5% - 2.0% ] 1.84% | 41,560 | 64.8% |
[ 1.5% - 2.0% ] 1.87% | 10,801 | 44.4% |
[ 1.5% - 2.0% ] 1.94% | 465 | 84.1% |
[ 1.5% - 2.0% ] 1.95% | 8,543 | 55.6% |
[ 2.0% - 2.5% ] 2.14% | 63,439 | 63.7% |
[ 2.0% - 2.5% ] 2.19% | 1,555 | 54.6% |
[ 2.0% - 2.5% ] 2.26% | 1,507 | 53.0% |
[ 2.0% - 2.5% ] 2.28% | 1,576 | 30.8% |
[ 2.5% - 3.0% ] 2.52% | 159 | 60.7% |
[ 2.5% - 3.0% ] 2.61% | 8,571 | 72.1% |
[ 3.0% - 3.5% ] 3.08% | 130 | 55.9% |
[ 3.0% - 3.5% ] 3.23% | 279 | 71.1% |
[ 3.0% - 3.5% ] 3.39% | 3,627 | 33.2% |
[ 3.0% - 3.5% ] 3.50% | 686 | 61.6% |
[ 4.0% - 4.5% ] 4.04% | 4,135 | 50.1% |
[ 4.0% - 4.5% ] 4.14% | 9,571 | 66.5% |
[ 4.5% - 5.0% ] 4.56% | 548 | 36.3% |
[ 5.5% - 6.0% ] 5.98% | 5,065 | 55.5% |
[ 6.5% - 7.0% ] 6.68% | 853 | 57.4% |
[ 8.0% - 8.5% ] 8.28% | 157 | 47.5% |