Central American Indian 1 or more Vehicles in Household
COMPARE
Central American Indian
Select to Compare
1 or more Vehicles in Household
Central American Indian 1 or more Vehicles in Household
86.7%
1+ VEHICLES AVAILABLE
0.0/ 100
METRIC RATING
284th/ 347
METRIC RANK
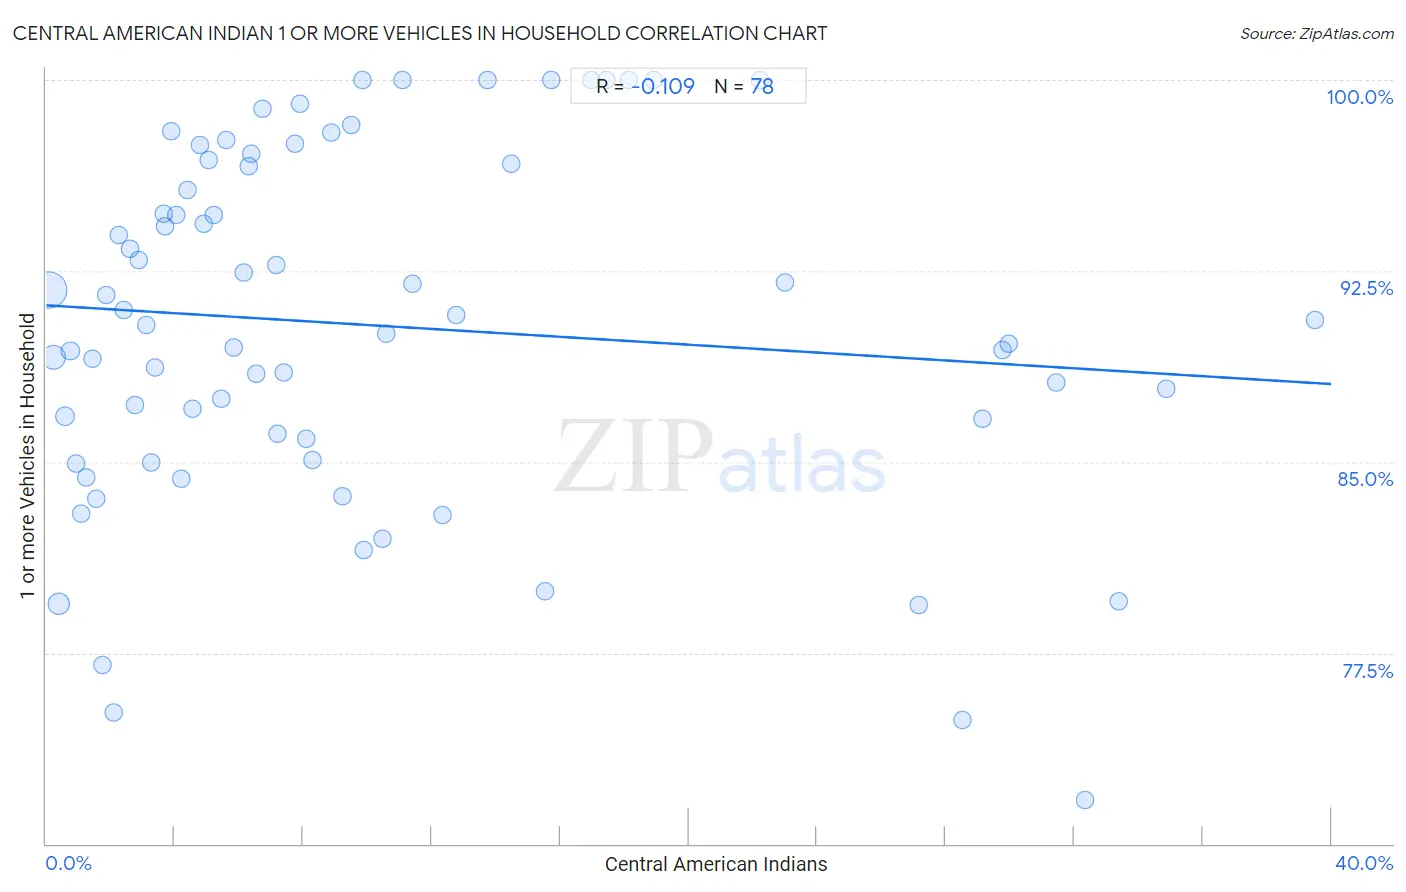
Central American Indian 1 or more Vehicles in Household Correlation Chart
The statistical analysis conducted on geographies consisting of 326,070,398 people shows a poor negative correlation between the proportion of Central American Indians and percentage of households with 1 or more vehicles available in the United States with a correlation coefficient (R) of -0.109 and weighted average of 86.7%. On average, for every 1% (one percent) increase in Central American Indians within a typical geography, there is a decrease of 0.077% in percentage of households with 1 or more vehicles available.
It is essential to understand that the correlation between the percentage of Central American Indians and percentage of households with 1 or more vehicles available does not imply a direct cause-and-effect relationship. It remains uncertain whether the presence of Central American Indians influences an upward or downward trend in the level of percentage of households with 1 or more vehicles available within an area, or if Central American Indians simply ended up residing in those areas with higher or lower levels of percentage of households with 1 or more vehicles available due to other factors.
Demographics Similar to Central American Indians by 1 or more Vehicles in Household
In terms of 1 or more vehicles in household, the demographic groups most similar to Central American Indians are Immigrants from Eastern Europe (86.7%, a difference of 0.0%), Colville (86.8%, a difference of 0.040%), Immigrants from Kazakhstan (86.6%, a difference of 0.20%), Immigrants from Eastern Asia (86.5%, a difference of 0.23%), and Mongolian (87.0%, a difference of 0.27%).
| Demographics | Rating | Rank | 1 or more Vehicles in Household |
| Alsatians | 0.1 /100 | #277 | Tragic 87.1% |
| Immigrants from Southern Europe | 0.1 /100 | #278 | Tragic 87.1% |
| Immigrants from Albania | 0.1 /100 | #279 | Tragic 87.1% |
| Immigrants from Croatia | 0.0 /100 | #280 | Tragic 87.0% |
| Mongolians | 0.0 /100 | #281 | Tragic 87.0% |
| Colville | 0.0 /100 | #282 | Tragic 86.8% |
| Immigrants from Eastern Europe | 0.0 /100 | #283 | Tragic 86.7% |
| Central American Indians | 0.0 /100 | #284 | Tragic 86.7% |
| Immigrants from Kazakhstan | 0.0 /100 | #285 | Tragic 86.6% |
| Immigrants from Eastern Asia | 0.0 /100 | #286 | Tragic 86.5% |
| Immigrants from Malaysia | 0.0 /100 | #287 | Tragic 86.5% |
| Hopi | 0.0 /100 | #288 | Tragic 86.4% |
| Immigrants from Ireland | 0.0 /100 | #289 | Tragic 86.4% |
| Immigrants from Australia | 0.0 /100 | #290 | Tragic 86.4% |
| Pima | 0.0 /100 | #291 | Tragic 86.3% |
Central American Indian 1 or more Vehicles in Household Correlation Summary
| Measurement | Central American Indian Data | 1 or more Vehicles in Household Data |
| Minimum | 0.074% | 71.7% |
| Maximum | 39.5% | 100.0% |
| Range | 39.4% | 28.3% |
| Mean | 10.2% | 90.4% |
| Median | 6.6% | 90.5% |
| Interquartile 25% (IQ1) | 3.3% | 85.9% |
| Interquartile 75% (IQ3) | 13.8% | 96.7% |
| Interquartile Range (IQR) | 10.5% | 10.8% |
| Standard Deviation (Sample) | 9.8% | 7.0% |
| Standard Deviation (Population) | 9.8% | 6.9% |
Correlation Details
| Central American Indian Percentile | Sample Size | 1 or more Vehicles in Household |
[ 0.0% - 0.5% ] 0.074% | 190,802,495 | 91.8% |
[ 0.0% - 0.5% ] 0.23% | 68,650,593 | 89.1% |
[ 0.0% - 0.5% ] 0.39% | 37,003,509 | 79.4% |
[ 0.5% - 1.0% ] 0.57% | 12,512,269 | 86.8% |
[ 0.5% - 1.0% ] 0.75% | 5,723,052 | 89.4% |
[ 0.5% - 1.0% ] 0.92% | 3,818,830 | 84.9% |
[ 1.0% - 1.5% ] 1.08% | 2,159,711 | 83.0% |
[ 1.0% - 1.5% ] 1.26% | 1,090,253 | 84.4% |
[ 1.0% - 1.5% ] 1.43% | 857,036 | 89.1% |
[ 1.5% - 2.0% ] 1.57% | 969,926 | 83.5% |
[ 1.5% - 2.0% ] 1.74% | 658,067 | 77.0% |
[ 1.5% - 2.0% ] 1.88% | 268,785 | 91.5% |
[ 2.0% - 2.5% ] 2.10% | 290,773 | 75.1% |
[ 2.0% - 2.5% ] 2.26% | 132,871 | 93.9% |
[ 2.0% - 2.5% ] 2.42% | 176,610 | 91.0% |
[ 2.5% - 3.0% ] 2.62% | 88,661 | 93.4% |
[ 2.5% - 3.0% ] 2.75% | 90,343 | 87.2% |
[ 2.5% - 3.0% ] 2.86% | 64,780 | 92.9% |
[ 3.0% - 3.5% ] 3.10% | 106,000 | 90.4% |
[ 3.0% - 3.5% ] 3.28% | 77,291 | 85.0% |
[ 3.0% - 3.5% ] 3.39% | 65,761 | 88.7% |
[ 3.5% - 4.0% ] 3.66% | 29,327 | 94.7% |
[ 3.5% - 4.0% ] 3.70% | 43,517 | 94.3% |
[ 3.5% - 4.0% ] 3.89% | 13,457 | 98.0% |
[ 4.0% - 4.5% ] 4.06% | 6,941 | 94.7% |
[ 4.0% - 4.5% ] 4.20% | 37,203 | 84.3% |
[ 4.0% - 4.5% ] 4.41% | 16,960 | 95.7% |
[ 4.5% - 5.0% ] 4.57% | 39,987 | 87.1% |
[ 4.5% - 5.0% ] 4.79% | 13,719 | 97.5% |
[ 4.5% - 5.0% ] 4.90% | 7,444 | 94.4% |
[ 5.0% - 5.5% ] 5.08% | 4,136 | 96.9% |
[ 5.0% - 5.5% ] 5.22% | 12,901 | 94.7% |
[ 5.0% - 5.5% ] 5.47% | 3,860 | 87.5% |
[ 5.5% - 6.0% ] 5.60% | 15,614 | 97.6% |
[ 5.5% - 6.0% ] 5.82% | 20,869 | 89.5% |
[ 6.0% - 6.5% ] 6.15% | 7,792 | 92.4% |
[ 6.0% - 6.5% ] 6.31% | 507 | 96.6% |
[ 6.0% - 6.5% ] 6.38% | 2,619 | 97.1% |
[ 6.5% - 7.0% ] 6.53% | 39,406 | 88.4% |
[ 6.5% - 7.0% ] 6.75% | 6,030 | 98.9% |
[ 7.0% - 7.5% ] 7.17% | 1,366 | 92.8% |
[ 7.0% - 7.5% ] 7.21% | 721 | 86.1% |
[ 7.0% - 7.5% ] 7.39% | 284 | 88.5% |
[ 7.5% - 8.0% ] 7.74% | 5,722 | 97.5% |
[ 7.5% - 8.0% ] 7.91% | 759 | 99.0% |
[ 8.0% - 8.5% ] 8.11% | 2,663 | 85.9% |
[ 8.0% - 8.5% ] 8.30% | 795 | 85.1% |
[ 8.5% - 9.0% ] 8.87% | 958 | 97.9% |
[ 9.0% - 9.5% ] 9.23% | 1,181 | 83.7% |
[ 9.0% - 9.5% ] 9.48% | 485 | 98.2% |
[ 9.5% - 10.0% ] 9.84% | 244 | 100.0% |
[ 9.5% - 10.0% ] 9.89% | 1,324 | 81.5% |
[ 10.0% - 10.5% ] 10.46% | 736 | 82.0% |
[ 10.5% - 11.0% ] 10.59% | 11,179 | 90.0% |
[ 11.0% - 11.5% ] 11.07% | 587 | 100.0% |
[ 11.0% - 11.5% ] 11.41% | 5,024 | 92.0% |
[ 12.0% - 12.5% ] 12.32% | 2,386 | 82.9% |
[ 12.5% - 13.0% ] 12.77% | 141 | 90.8% |
[ 13.5% - 14.0% ] 13.75% | 1,396 | 100.0% |
[ 14.0% - 14.5% ] 14.47% | 159 | 96.7% |
[ 15.5% - 16.0% ] 15.51% | 1,438 | 79.9% |
[ 15.5% - 16.0% ] 15.70% | 363 | 100.0% |
[ 16.5% - 17.0% ] 16.95% | 655 | 100.0% |
[ 17.0% - 17.5% ] 17.44% | 1,674 | 100.0% |
[ 18.0% - 18.5% ] 18.13% | 1,611 | 100.0% |
[ 18.5% - 19.0% ] 18.92% | 872 | 100.0% |
[ 22.0% - 22.5% ] 22.22% | 27 | 100.0% |
[ 23.0% - 23.5% ] 23.01% | 1,130 | 92.1% |
[ 27.0% - 27.5% ] 27.16% | 3,233 | 79.4% |
[ 28.5% - 29.0% ] 28.54% | 2,190 | 74.9% |
[ 29.0% - 29.5% ] 29.16% | 2,658 | 86.7% |
[ 29.5% - 30.0% ] 29.78% | 1,632 | 89.4% |
[ 29.5% - 30.0% ] 29.95% | 25,542 | 89.6% |
[ 31.0% - 31.5% ] 31.46% | 4,562 | 88.1% |
[ 32.0% - 32.5% ] 32.32% | 362 | 71.7% |
[ 33.0% - 33.5% ] 33.40% | 1,488 | 79.5% |
[ 34.5% - 35.0% ] 34.88% | 37,642 | 87.9% |
[ 39.0% - 39.5% ] 39.48% | 15,304 | 90.6% |