Central American Indian 4 or more Vehicles in Household
COMPARE
Central American Indian
Select to Compare
4 or more Vehicles in Household
Central American Indian 4 or more Vehicles in Household
6.5%
4+ VEHICLES AVAILABLE
71.1/ 100
METRIC RATING
154th/ 347
METRIC RANK
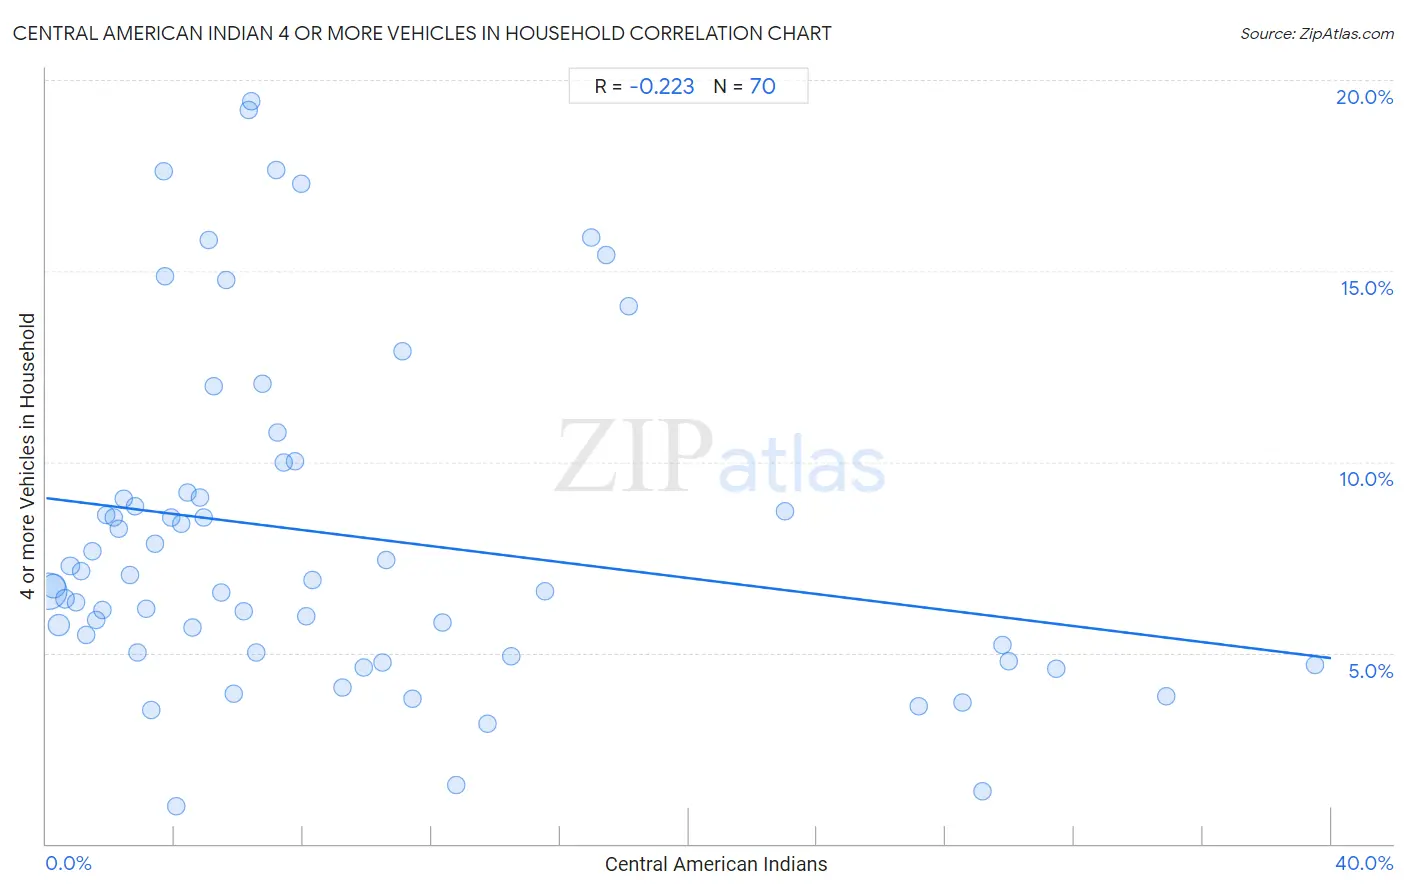
Central American Indian 4 or more Vehicles in Household Correlation Chart
The statistical analysis conducted on geographies consisting of 324,790,558 people shows a weak negative correlation between the proportion of Central American Indians and percentage of households with 4 or more vehicles available in the United States with a correlation coefficient (R) of -0.223 and weighted average of 6.5%. On average, for every 1% (one percent) increase in Central American Indians within a typical geography, there is a decrease of 0.10% in percentage of households with 4 or more vehicles available.
It is essential to understand that the correlation between the percentage of Central American Indians and percentage of households with 4 or more vehicles available does not imply a direct cause-and-effect relationship. It remains uncertain whether the presence of Central American Indians influences an upward or downward trend in the level of percentage of households with 4 or more vehicles available within an area, or if Central American Indians simply ended up residing in those areas with higher or lower levels of percentage of households with 4 or more vehicles available due to other factors.
Demographics Similar to Central American Indians by 4 or more Vehicles in Household
In terms of 4 or more vehicles in household, the demographic groups most similar to Central American Indians are Immigrants from Armenia (6.5%, a difference of 0.010%), Iroquois (6.5%, a difference of 0.080%), Yuman (6.5%, a difference of 0.13%), Immigrants from Hong Kong (6.5%, a difference of 0.14%), and Iranian (6.5%, a difference of 0.14%).
| Demographics | Rating | Rank | 4 or more Vehicles in Household |
| Immigrants from Iran | 73.9 /100 | #147 | Good 6.5% |
| Immigrants from Jordan | 73.7 /100 | #148 | Good 6.5% |
| Greeks | 73.6 /100 | #149 | Good 6.5% |
| New Zealanders | 73.3 /100 | #150 | Good 6.5% |
| Immigrants from Hong Kong | 72.2 /100 | #151 | Good 6.5% |
| Yuman | 72.1 /100 | #152 | Good 6.5% |
| Immigrants from Armenia | 71.2 /100 | #153 | Good 6.5% |
| Central American Indians | 71.1 /100 | #154 | Good 6.5% |
| Iroquois | 70.4 /100 | #155 | Good 6.5% |
| Iranians | 69.9 /100 | #156 | Good 6.5% |
| Peruvians | 69.4 /100 | #157 | Good 6.5% |
| Zimbabweans | 67.1 /100 | #158 | Good 6.4% |
| Indians (Asian) | 66.3 /100 | #159 | Good 6.4% |
| Palestinians | 65.8 /100 | #160 | Good 6.4% |
| Immigrants from Cameroon | 64.4 /100 | #161 | Good 6.4% |
Central American Indian 4 or more Vehicles in Household Correlation Summary
| Measurement | Central American Indian Data | 4 or more Vehicles in Household Data |
| Minimum | 0.074% | 1.00% |
| Maximum | 39.5% | 19.4% |
| Range | 39.4% | 18.4% |
| Mean | 9.2% | 8.1% |
| Median | 6.0% | 6.8% |
| Interquartile 25% (IQ1) | 2.9% | 5.0% |
| Interquartile 75% (IQ3) | 11.4% | 9.2% |
| Interquartile Range (IQR) | 8.5% | 4.2% |
| Standard Deviation (Sample) | 9.4% | 4.4% |
| Standard Deviation (Population) | 9.3% | 4.4% |
Correlation Details
| Central American Indian Percentile | Sample Size | 4 or more Vehicles in Household |
[ 0.0% - 0.5% ] 0.074% | 190,338,023 | 6.6% |
[ 0.0% - 0.5% ] 0.23% | 68,335,155 | 6.8% |
[ 0.0% - 0.5% ] 0.39% | 36,889,589 | 5.7% |
[ 0.5% - 1.0% ] 0.57% | 12,456,149 | 6.4% |
[ 0.5% - 1.0% ] 0.75% | 5,684,691 | 7.3% |
[ 0.5% - 1.0% ] 0.91% | 3,734,539 | 6.3% |
[ 1.0% - 1.5% ] 1.08% | 2,096,947 | 7.1% |
[ 1.0% - 1.5% ] 1.26% | 1,090,253 | 5.5% |
[ 1.0% - 1.5% ] 1.43% | 850,110 | 7.7% |
[ 1.5% - 2.0% ] 1.57% | 924,754 | 5.9% |
[ 1.5% - 2.0% ] 1.74% | 655,733 | 6.1% |
[ 1.5% - 2.0% ] 1.88% | 268,785 | 8.6% |
[ 2.0% - 2.5% ] 2.09% | 230,784 | 8.5% |
[ 2.0% - 2.5% ] 2.26% | 132,871 | 8.2% |
[ 2.0% - 2.5% ] 2.42% | 163,596 | 9.0% |
[ 2.5% - 3.0% ] 2.62% | 88,661 | 7.0% |
[ 2.5% - 3.0% ] 2.75% | 90,343 | 8.9% |
[ 2.5% - 3.0% ] 2.86% | 64,212 | 5.0% |
[ 3.0% - 3.5% ] 3.10% | 106,000 | 6.2% |
[ 3.0% - 3.5% ] 3.28% | 77,291 | 3.5% |
[ 3.0% - 3.5% ] 3.39% | 65,315 | 7.8% |
[ 3.5% - 4.0% ] 3.66% | 29,327 | 17.6% |
[ 3.5% - 4.0% ] 3.70% | 42,650 | 14.9% |
[ 3.5% - 4.0% ] 3.90% | 11,227 | 8.6% |
[ 4.0% - 4.5% ] 4.06% | 4,806 | 1.00% |
[ 4.0% - 4.5% ] 4.20% | 37,203 | 8.4% |
[ 4.0% - 4.5% ] 4.41% | 16,370 | 9.2% |
[ 4.5% - 5.0% ] 4.57% | 39,987 | 5.7% |
[ 4.5% - 5.0% ] 4.80% | 12,084 | 9.1% |
[ 4.5% - 5.0% ] 4.90% | 7,444 | 8.5% |
[ 5.0% - 5.5% ] 5.05% | 1,286 | 15.8% |
[ 5.0% - 5.5% ] 5.22% | 12,346 | 12.0% |
[ 5.0% - 5.5% ] 5.47% | 3,860 | 6.6% |
[ 5.5% - 6.0% ] 5.60% | 15,614 | 14.8% |
[ 5.5% - 6.0% ] 5.82% | 20,869 | 3.9% |
[ 6.0% - 6.5% ] 6.15% | 7,792 | 6.1% |
[ 6.0% - 6.5% ] 6.31% | 507 | 19.2% |
[ 6.0% - 6.5% ] 6.38% | 2,619 | 19.4% |
[ 6.5% - 7.0% ] 6.53% | 39,406 | 5.0% |
[ 6.5% - 7.0% ] 6.75% | 6,030 | 12.0% |
[ 7.0% - 7.5% ] 7.17% | 1,366 | 17.7% |
[ 7.0% - 7.5% ] 7.21% | 721 | 10.8% |
[ 7.0% - 7.5% ] 7.38% | 149 | 10.0% |
[ 7.5% - 8.0% ] 7.74% | 5,722 | 10.0% |
[ 7.5% - 8.0% ] 7.92% | 530 | 17.3% |
[ 8.0% - 8.5% ] 8.11% | 2,663 | 6.0% |
[ 8.0% - 8.5% ] 8.30% | 795 | 6.9% |
[ 9.0% - 9.5% ] 9.23% | 1,181 | 4.1% |
[ 9.5% - 10.0% ] 9.89% | 1,324 | 4.6% |
[ 10.0% - 10.5% ] 10.46% | 736 | 4.7% |
[ 10.5% - 11.0% ] 10.59% | 11,179 | 7.4% |
[ 11.0% - 11.5% ] 11.07% | 587 | 12.9% |
[ 11.0% - 11.5% ] 11.41% | 5,024 | 3.8% |
[ 12.0% - 12.5% ] 12.32% | 2,386 | 5.8% |
[ 12.5% - 13.0% ] 12.77% | 141 | 1.5% |
[ 13.5% - 14.0% ] 13.75% | 1,396 | 3.1% |
[ 14.0% - 14.5% ] 14.47% | 159 | 4.9% |
[ 15.5% - 16.0% ] 15.51% | 1,438 | 6.6% |
[ 16.5% - 17.0% ] 16.95% | 655 | 15.9% |
[ 17.0% - 17.5% ] 17.44% | 1,674 | 15.4% |
[ 18.0% - 18.5% ] 18.13% | 1,611 | 14.1% |
[ 23.0% - 23.5% ] 23.01% | 1,130 | 8.7% |
[ 27.0% - 27.5% ] 27.16% | 3,233 | 3.6% |
[ 28.5% - 29.0% ] 28.54% | 2,190 | 3.7% |
[ 29.0% - 29.5% ] 29.16% | 2,658 | 1.4% |
[ 29.5% - 30.0% ] 29.78% | 1,632 | 5.2% |
[ 29.5% - 30.0% ] 29.95% | 25,542 | 4.8% |
[ 31.0% - 31.5% ] 31.46% | 4,562 | 4.6% |
[ 34.5% - 35.0% ] 34.88% | 37,642 | 3.9% |
[ 39.0% - 39.5% ] 39.48% | 15,304 | 4.7% |