Central American Indian Married-Couple Family Poverty
COMPARE
Central American Indian
Select to Compare
Married-Couple Family Poverty
Central American Indian Married-Couple Family Poverty
8.3%
POVERTY | MARRIED-COUPLE FAMILIES
0.0/ 100
METRIC RATING
331st/ 347
METRIC RANK
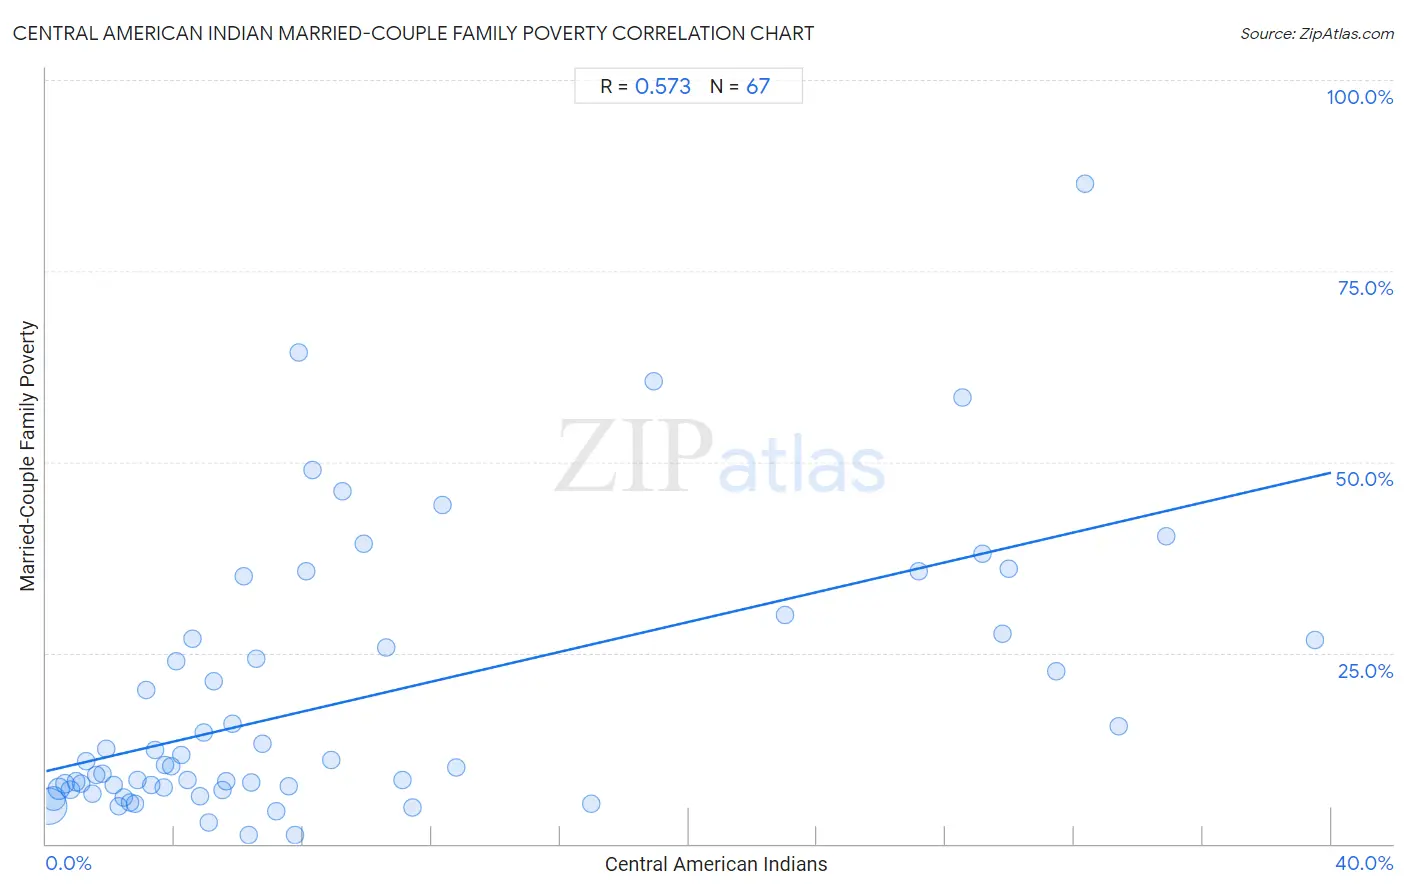
Central American Indian Married-Couple Family Poverty Correlation Chart
The statistical analysis conducted on geographies consisting of 324,694,241 people shows a substantial positive correlation between the proportion of Central American Indians and poverty level among married-couple families in the United States with a correlation coefficient (R) of 0.573 and weighted average of 8.3%. On average, for every 1% (one percent) increase in Central American Indians within a typical geography, there is an increase of 0.98% in poverty level among married-couple families.
It is essential to understand that the correlation between the percentage of Central American Indians and poverty level among married-couple families does not imply a direct cause-and-effect relationship. It remains uncertain whether the presence of Central American Indians influences an upward or downward trend in the level of poverty level among married-couple families within an area, or if Central American Indians simply ended up residing in those areas with higher or lower levels of poverty level among married-couple families due to other factors.
Demographics Similar to Central American Indians by Married-Couple Family Poverty
In terms of married-couple family poverty, the demographic groups most similar to Central American Indians are Paiute (8.3%, a difference of 0.060%), Dominican (8.3%, a difference of 0.060%), Lumbee (8.3%, a difference of 0.53%), Immigrants from Dominican Republic (8.4%, a difference of 1.2%), and Native/Alaskan (8.2%, a difference of 1.3%).
| Demographics | Rating | Rank | Married-Couple Family Poverty |
| Immigrants from Central America | 0.0 /100 | #324 | Tragic 7.4% |
| Immigrants from Cuba | 0.0 /100 | #325 | Tragic 7.5% |
| Immigrants from Bangladesh | 0.0 /100 | #326 | Tragic 7.5% |
| Hispanics or Latinos | 0.0 /100 | #327 | Tragic 7.5% |
| Immigrants from Mexico | 0.0 /100 | #328 | Tragic 7.6% |
| Natives/Alaskans | 0.0 /100 | #329 | Tragic 8.2% |
| Paiute | 0.0 /100 | #330 | Tragic 8.3% |
| Central American Indians | 0.0 /100 | #331 | Tragic 8.3% |
| Dominicans | 0.0 /100 | #332 | Tragic 8.3% |
| Lumbee | 0.0 /100 | #333 | Tragic 8.3% |
| Immigrants from Dominican Republic | 0.0 /100 | #334 | Tragic 8.4% |
| Sioux | 0.0 /100 | #335 | Tragic 8.7% |
| Apache | 0.0 /100 | #336 | Tragic 9.0% |
| Yakama | 0.0 /100 | #337 | Tragic 9.0% |
| Cheyenne | 0.0 /100 | #338 | Tragic 9.4% |
Central American Indian Married-Couple Family Poverty Correlation Summary
| Measurement | Central American Indian Data | Married-Couple Family Poverty Data |
| Minimum | 0.074% | 1.2% |
| Maximum | 39.5% | 86.5% |
| Range | 39.4% | 85.3% |
| Mean | 9.6% | 18.9% |
| Median | 5.6% | 10.3% |
| Interquartile 25% (IQ1) | 2.8% | 7.2% |
| Interquartile 75% (IQ3) | 11.1% | 26.8% |
| Interquartile Range (IQR) | 8.3% | 19.6% |
| Standard Deviation (Sample) | 10.3% | 17.6% |
| Standard Deviation (Population) | 10.3% | 17.5% |
Correlation Details
| Central American Indian Percentile | Sample Size | Married-Couple Family Poverty |
[ 0.0% - 0.5% ] 0.074% | 190,347,259 | 4.9% |
[ 0.0% - 0.5% ] 0.23% | 68,327,893 | 5.9% |
[ 0.0% - 0.5% ] 0.39% | 36,876,016 | 7.2% |
[ 0.5% - 1.0% ] 0.57% | 12,328,040 | 7.9% |
[ 0.5% - 1.0% ] 0.75% | 5,676,720 | 7.1% |
[ 0.5% - 1.0% ] 0.92% | 3,762,387 | 8.1% |
[ 1.0% - 1.5% ] 1.08% | 2,125,804 | 7.9% |
[ 1.0% - 1.5% ] 1.26% | 1,057,294 | 10.8% |
[ 1.0% - 1.5% ] 1.43% | 841,781 | 6.6% |
[ 1.5% - 2.0% ] 1.57% | 947,841 | 9.1% |
[ 1.5% - 2.0% ] 1.74% | 643,858 | 9.2% |
[ 1.5% - 2.0% ] 1.88% | 263,166 | 12.4% |
[ 2.0% - 2.5% ] 2.10% | 277,708 | 7.6% |
[ 2.0% - 2.5% ] 2.26% | 127,910 | 4.9% |
[ 2.0% - 2.5% ] 2.42% | 174,081 | 6.1% |
[ 2.5% - 3.0% ] 2.62% | 87,135 | 5.4% |
[ 2.5% - 3.0% ] 2.75% | 89,527 | 5.3% |
[ 2.5% - 3.0% ] 2.86% | 64,108 | 8.3% |
[ 3.0% - 3.5% ] 3.10% | 106,000 | 20.1% |
[ 3.0% - 3.5% ] 3.29% | 72,203 | 7.7% |
[ 3.0% - 3.5% ] 3.39% | 61,267 | 12.3% |
[ 3.5% - 4.0% ] 3.66% | 29,327 | 7.3% |
[ 3.5% - 4.0% ] 3.70% | 42,875 | 10.3% |
[ 3.5% - 4.0% ] 3.89% | 13,405 | 10.2% |
[ 4.0% - 4.5% ] 4.06% | 4,806 | 24.0% |
[ 4.0% - 4.5% ] 4.20% | 36,509 | 11.7% |
[ 4.0% - 4.5% ] 4.41% | 16,505 | 8.3% |
[ 4.5% - 5.0% ] 4.57% | 39,457 | 26.8% |
[ 4.5% - 5.0% ] 4.80% | 8,774 | 6.1% |
[ 4.5% - 5.0% ] 4.90% | 7,200 | 14.6% |
[ 5.0% - 5.5% ] 5.08% | 4,136 | 2.8% |
[ 5.0% - 5.5% ] 5.21% | 12,486 | 21.2% |
[ 5.0% - 5.5% ] 5.50% | 1,528 | 7.1% |
[ 5.5% - 6.0% ] 5.60% | 14,201 | 8.2% |
[ 5.5% - 6.0% ] 5.82% | 20,458 | 15.7% |
[ 6.0% - 6.5% ] 6.15% | 7,792 | 35.1% |
[ 6.0% - 6.5% ] 6.31% | 507 | 1.2% |
[ 6.0% - 6.5% ] 6.38% | 2,619 | 8.0% |
[ 6.5% - 7.0% ] 6.53% | 39,406 | 24.2% |
[ 6.5% - 7.0% ] 6.72% | 3,807 | 13.1% |
[ 7.0% - 7.5% ] 7.17% | 1,366 | 4.3% |
[ 7.5% - 8.0% ] 7.55% | 742 | 7.5% |
[ 7.5% - 8.0% ] 7.74% | 5,462 | 1.2% |
[ 7.5% - 8.0% ] 7.86% | 229 | 64.3% |
[ 8.0% - 8.5% ] 8.11% | 2,663 | 35.7% |
[ 8.0% - 8.5% ] 8.30% | 795 | 48.9% |
[ 8.5% - 9.0% ] 8.87% | 958 | 11.0% |
[ 9.0% - 9.5% ] 9.23% | 1,181 | 46.2% |
[ 9.5% - 10.0% ] 9.89% | 1,324 | 39.3% |
[ 10.5% - 11.0% ] 10.59% | 11,179 | 25.7% |
[ 11.0% - 11.5% ] 11.07% | 587 | 8.4% |
[ 11.0% - 11.5% ] 11.39% | 4,162 | 4.7% |
[ 12.0% - 12.5% ] 12.32% | 2,386 | 44.3% |
[ 12.5% - 13.0% ] 12.77% | 141 | 10.0% |
[ 16.5% - 17.0% ] 16.95% | 655 | 5.2% |
[ 18.5% - 19.0% ] 18.92% | 872 | 60.6% |
[ 23.0% - 23.5% ] 23.01% | 1,130 | 29.9% |
[ 27.0% - 27.5% ] 27.16% | 3,233 | 35.6% |
[ 28.5% - 29.0% ] 28.54% | 2,190 | 58.4% |
[ 29.0% - 29.5% ] 29.16% | 2,658 | 38.0% |
[ 29.5% - 30.0% ] 29.78% | 1,632 | 27.4% |
[ 29.5% - 30.0% ] 29.95% | 25,542 | 36.0% |
[ 31.0% - 31.5% ] 31.46% | 4,562 | 22.6% |
[ 32.0% - 32.5% ] 32.32% | 362 | 86.5% |
[ 33.0% - 33.5% ] 33.40% | 1,488 | 15.4% |
[ 34.5% - 35.0% ] 34.88% | 37,642 | 40.3% |
[ 39.0% - 39.5% ] 39.48% | 15,304 | 26.6% |