Central American Indian Self-Care Disability
COMPARE
Central American Indian
Select to Compare
Self-Care Disability
Central American Indian Self-Care Disability
2.7%
SELF-CARE DISABILITY
0.0/ 100
METRIC RATING
292nd/ 347
METRIC RANK
Central American Indian Self-Care Disability Correlation Chart
The statistical analysis conducted on geographies consisting of 325,913,892 people shows a poor positive correlation between the proportion of Central American Indians and percentage of population with self-care disability in the United States with a correlation coefficient (R) of 0.102 and weighted average of 2.7%. On average, for every 1% (one percent) increase in Central American Indians within a typical geography, there is an increase of 0.020% in percentage of population with self-care disability.
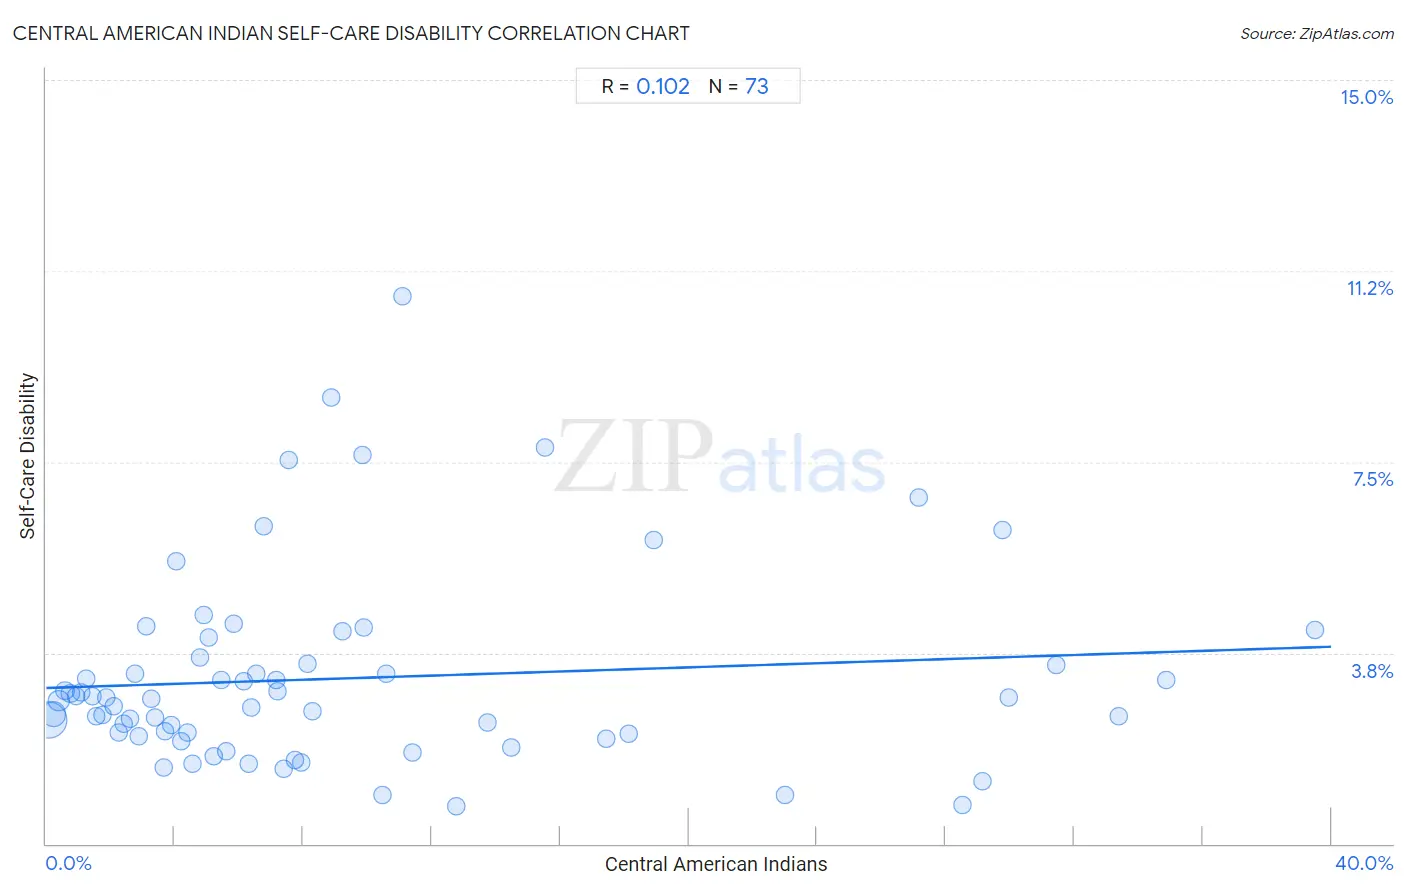
It is essential to understand that the correlation between the percentage of Central American Indians and percentage of population with self-care disability does not imply a direct cause-and-effect relationship. It remains uncertain whether the presence of Central American Indians influences an upward or downward trend in the level of percentage of population with self-care disability within an area, or if Central American Indians simply ended up residing in those areas with higher or lower levels of percentage of population with self-care disability due to other factors.
Demographics Similar to Central American Indians by Self-Care Disability
In terms of self-care disability, the demographic groups most similar to Central American Indians are Belizean (2.7%, a difference of 0.0%), Blackfeet (2.7%, a difference of 0.010%), Barbadian (2.7%, a difference of 0.15%), Guyanese (2.7%, a difference of 0.16%), and Cuban (2.7%, a difference of 0.42%).
| Demographics | Rating | Rank | Self-Care Disability |
| Jamaicans | 0.0 /100 | #285 | Tragic 2.7% |
| French American Indians | 0.0 /100 | #286 | Tragic 2.7% |
| Immigrants from Jamaica | 0.0 /100 | #287 | Tragic 2.7% |
| Immigrants from Barbados | 0.0 /100 | #288 | Tragic 2.7% |
| Africans | 0.0 /100 | #289 | Tragic 2.7% |
| Cubans | 0.0 /100 | #290 | Tragic 2.7% |
| Guyanese | 0.0 /100 | #291 | Tragic 2.7% |
| Central American Indians | 0.0 /100 | #292 | Tragic 2.7% |
| Belizeans | 0.0 /100 | #293 | Tragic 2.7% |
| Blackfeet | 0.0 /100 | #294 | Tragic 2.7% |
| Barbadians | 0.0 /100 | #295 | Tragic 2.7% |
| Immigrants from Portugal | 0.0 /100 | #296 | Tragic 2.8% |
| West Indians | 0.0 /100 | #297 | Tragic 2.8% |
| Americans | 0.0 /100 | #298 | Tragic 2.8% |
| Immigrants from Guyana | 0.0 /100 | #299 | Tragic 2.8% |
Central American Indian Self-Care Disability Correlation Summary
| Measurement | Central American Indian Data | Self-Care Disability Data |
| Minimum | 0.074% | 0.73% |
| Maximum | 39.5% | 10.8% |
| Range | 39.4% | 10.0% |
| Mean | 9.5% | 3.3% |
| Median | 6.3% | 2.8% |
| Interquartile 25% (IQ1) | 3.0% | 2.1% |
| Interquartile 75% (IQ3) | 11.2% | 3.6% |
| Interquartile Range (IQR) | 8.3% | 1.5% |
| Standard Deviation (Sample) | 9.6% | 1.9% |
| Standard Deviation (Population) | 9.6% | 1.9% |
Correlation Details
| Central American Indian Percentile | Sample Size | Self-Care Disability |
[ 0.0% - 0.5% ] 0.074% | 190,777,763 | 2.4% |
[ 0.0% - 0.5% ] 0.23% | 68,617,343 | 2.5% |
[ 0.0% - 0.5% ] 0.39% | 36,973,741 | 2.8% |
[ 0.5% - 1.0% ] 0.57% | 12,504,584 | 3.0% |
[ 0.5% - 1.0% ] 0.75% | 5,722,105 | 3.0% |
[ 0.5% - 1.0% ] 0.92% | 3,809,529 | 2.9% |
[ 1.0% - 1.5% ] 1.08% | 2,147,918 | 3.0% |
[ 1.0% - 1.5% ] 1.26% | 1,083,517 | 3.2% |
[ 1.0% - 1.5% ] 1.43% | 855,258 | 2.9% |
[ 1.5% - 2.0% ] 1.57% | 969,926 | 2.5% |
[ 1.5% - 2.0% ] 1.74% | 657,030 | 2.5% |
[ 1.5% - 2.0% ] 1.88% | 268,631 | 2.9% |
[ 2.0% - 2.5% ] 2.10% | 290,487 | 2.7% |
[ 2.0% - 2.5% ] 2.26% | 132,871 | 2.2% |
[ 2.0% - 2.5% ] 2.42% | 176,610 | 2.3% |
[ 2.5% - 3.0% ] 2.62% | 88,661 | 2.5% |
[ 2.5% - 3.0% ] 2.75% | 77,512 | 3.3% |
[ 2.5% - 3.0% ] 2.86% | 64,780 | 2.1% |
[ 3.0% - 3.5% ] 3.10% | 106,000 | 4.3% |
[ 3.0% - 3.5% ] 3.29% | 75,918 | 2.8% |
[ 3.0% - 3.5% ] 3.39% | 65,761 | 2.5% |
[ 3.5% - 4.0% ] 3.66% | 29,327 | 1.5% |
[ 3.5% - 4.0% ] 3.70% | 43,517 | 2.2% |
[ 3.5% - 4.0% ] 3.89% | 13,457 | 2.3% |
[ 4.0% - 4.5% ] 4.06% | 6,941 | 5.5% |
[ 4.0% - 4.5% ] 4.20% | 37,203 | 2.0% |
[ 4.0% - 4.5% ] 4.41% | 16,777 | 2.2% |
[ 4.5% - 5.0% ] 4.57% | 36,405 | 1.6% |
[ 4.5% - 5.0% ] 4.79% | 13,719 | 3.7% |
[ 4.5% - 5.0% ] 4.90% | 7,444 | 4.5% |
[ 5.0% - 5.5% ] 5.08% | 4,136 | 4.1% |
[ 5.0% - 5.5% ] 5.22% | 10,623 | 1.7% |
[ 5.0% - 5.5% ] 5.47% | 3,860 | 3.2% |
[ 5.5% - 6.0% ] 5.60% | 15,614 | 1.8% |
[ 5.5% - 6.0% ] 5.82% | 20,869 | 4.3% |
[ 6.0% - 6.5% ] 6.15% | 7,792 | 3.2% |
[ 6.0% - 6.5% ] 6.31% | 507 | 1.6% |
[ 6.0% - 6.5% ] 6.38% | 2,619 | 2.7% |
[ 6.5% - 7.0% ] 6.53% | 39,406 | 3.3% |
[ 6.5% - 7.0% ] 6.75% | 3,420 | 6.2% |
[ 7.0% - 7.5% ] 7.17% | 1,366 | 3.2% |
[ 7.0% - 7.5% ] 7.21% | 721 | 3.0% |
[ 7.0% - 7.5% ] 7.38% | 149 | 1.5% |
[ 7.5% - 8.0% ] 7.54% | 557 | 7.5% |
[ 7.5% - 8.0% ] 7.74% | 5,722 | 1.6% |
[ 7.5% - 8.0% ] 7.92% | 530 | 1.6% |
[ 8.0% - 8.5% ] 8.15% | 1,608 | 3.5% |
[ 8.0% - 8.5% ] 8.30% | 795 | 2.6% |
[ 8.5% - 9.0% ] 8.87% | 958 | 8.8% |
[ 9.0% - 9.5% ] 9.23% | 1,181 | 4.2% |
[ 9.5% - 10.0% ] 9.84% | 244 | 7.6% |
[ 9.5% - 10.0% ] 9.89% | 1,324 | 4.3% |
[ 10.0% - 10.5% ] 10.46% | 736 | 0.95% |
[ 10.5% - 11.0% ] 10.58% | 10,137 | 3.3% |
[ 11.0% - 11.5% ] 11.07% | 587 | 10.8% |
[ 11.0% - 11.5% ] 11.41% | 5,024 | 1.8% |
[ 12.5% - 13.0% ] 12.77% | 141 | 0.73% |
[ 13.5% - 14.0% ] 13.75% | 1,396 | 2.4% |
[ 14.0% - 14.5% ] 14.47% | 159 | 1.9% |
[ 15.5% - 16.0% ] 15.51% | 1,438 | 7.8% |
[ 17.0% - 17.5% ] 17.44% | 1,674 | 2.1% |
[ 18.0% - 18.5% ] 18.13% | 1,611 | 2.2% |
[ 18.5% - 19.0% ] 18.92% | 872 | 6.0% |
[ 23.0% - 23.5% ] 23.01% | 1,130 | 0.95% |
[ 27.0% - 27.5% ] 27.16% | 3,233 | 6.8% |
[ 28.5% - 29.0% ] 28.54% | 2,190 | 0.76% |
[ 29.0% - 29.5% ] 29.16% | 2,658 | 1.2% |
[ 29.5% - 30.0% ] 29.78% | 1,632 | 6.2% |
[ 29.5% - 30.0% ] 29.95% | 25,542 | 2.9% |
[ 31.0% - 31.5% ] 31.46% | 4,562 | 3.5% |
[ 33.0% - 33.5% ] 33.40% | 1,488 | 2.5% |
[ 34.5% - 35.0% ] 34.88% | 37,642 | 3.2% |
[ 39.0% - 39.5% ] 39.48% | 15,304 | 4.2% |