Bulgarian Self-Care Disability
COMPARE
Bulgarian
Select to Compare
Self-Care Disability
Bulgarian Self-Care Disability
2.2%
SELF-CARE DISABILITY
100.0/ 100
METRIC RATING
21st/ 347
METRIC RANK
Bulgarian Self-Care Disability Correlation Chart
The statistical analysis conducted on geographies consisting of 205,516,049 people shows no correlation between the proportion of Bulgarians and percentage of population with self-care disability in the United States with a correlation coefficient (R) of 0.041 and weighted average of 2.2%. On average, for every 1% (one percent) increase in Bulgarians within a typical geography, there is an increase of 0.024% in percentage of population with self-care disability.
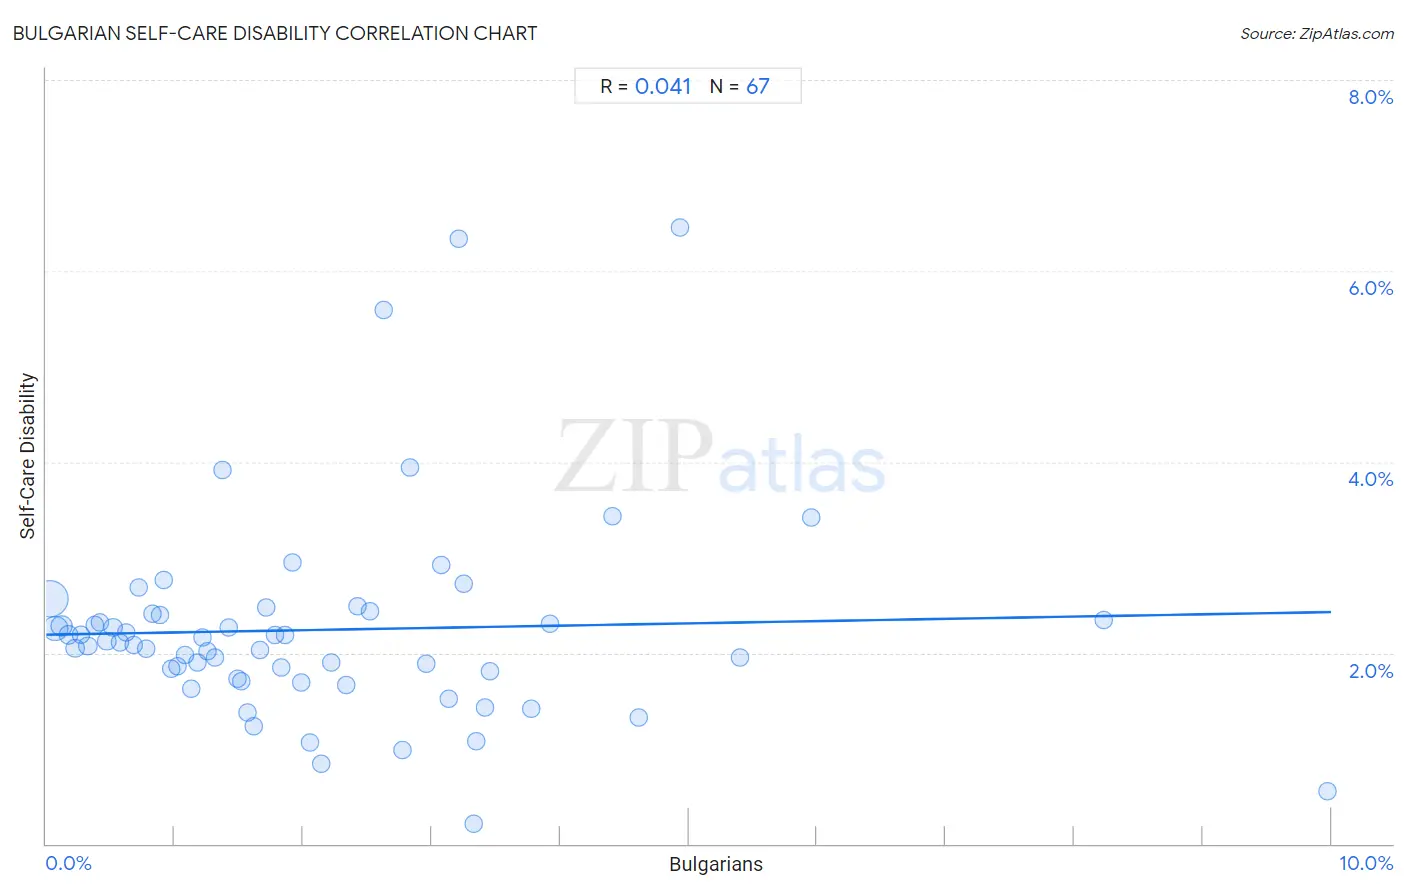
It is essential to understand that the correlation between the percentage of Bulgarians and percentage of population with self-care disability does not imply a direct cause-and-effect relationship. It remains uncertain whether the presence of Bulgarians influences an upward or downward trend in the level of percentage of population with self-care disability within an area, or if Bulgarians simply ended up residing in those areas with higher or lower levels of percentage of population with self-care disability due to other factors.
Demographics Similar to Bulgarians by Self-Care Disability
In terms of self-care disability, the demographic groups most similar to Bulgarians are Immigrants from Venezuela (2.2%, a difference of 0.040%), Tongan (2.2%, a difference of 0.25%), Cambodian (2.2%, a difference of 0.25%), Immigrants from Eritrea (2.2%, a difference of 0.33%), and Cypriot (2.2%, a difference of 0.55%).
| Demographics | Rating | Rank | Self-Care Disability |
| Luxembourgers | 100.0 /100 | #14 | Exceptional 2.2% |
| Okinawans | 100.0 /100 | #15 | Exceptional 2.2% |
| Immigrants from Kuwait | 100.0 /100 | #16 | Exceptional 2.2% |
| Immigrants from Saudi Arabia | 100.0 /100 | #17 | Exceptional 2.2% |
| Immigrants from Taiwan | 100.0 /100 | #18 | Exceptional 2.2% |
| Immigrants from Eritrea | 100.0 /100 | #19 | Exceptional 2.2% |
| Tongans | 100.0 /100 | #20 | Exceptional 2.2% |
| Bulgarians | 100.0 /100 | #21 | Exceptional 2.2% |
| Immigrants from Venezuela | 100.0 /100 | #22 | Exceptional 2.2% |
| Cambodians | 100.0 /100 | #23 | Exceptional 2.2% |
| Cypriots | 100.0 /100 | #24 | Exceptional 2.2% |
| Turks | 100.0 /100 | #25 | Exceptional 2.2% |
| Immigrants from Sri Lanka | 99.9 /100 | #26 | Exceptional 2.2% |
| Venezuelans | 99.9 /100 | #27 | Exceptional 2.2% |
| Inupiat | 99.9 /100 | #28 | Exceptional 2.2% |
Bulgarian Self-Care Disability Correlation Summary
| Measurement | Bulgarian Data | Self-Care Disability Data |
| Minimum | 0.025% | 0.21% |
| Maximum | 10.0% | 6.5% |
| Range | 9.9% | 6.2% |
| Mean | 2.1% | 2.2% |
| Median | 1.7% | 2.1% |
| Interquartile 25% (IQ1) | 0.83% | 1.7% |
| Interquartile 75% (IQ3) | 3.1% | 2.4% |
| Interquartile Range (IQR) | 2.2% | 0.68% |
| Standard Deviation (Sample) | 1.9% | 1.1% |
| Standard Deviation (Population) | 1.8% | 1.1% |
Correlation Details
| Bulgarian Percentile | Sample Size | Self-Care Disability |
[ 0.0% - 0.5% ] 0.025% | 113,974,238 | 2.6% |
[ 0.0% - 0.5% ] 0.072% | 40,973,471 | 2.3% |
[ 0.0% - 0.5% ] 0.12% | 19,148,525 | 2.3% |
[ 0.0% - 0.5% ] 0.17% | 9,524,006 | 2.2% |
[ 0.0% - 0.5% ] 0.22% | 5,878,173 | 2.0% |
[ 0.0% - 0.5% ] 0.27% | 3,493,704 | 2.2% |
[ 0.0% - 0.5% ] 0.32% | 3,380,118 | 2.1% |
[ 0.0% - 0.5% ] 0.38% | 1,725,008 | 2.3% |
[ 0.0% - 0.5% ] 0.42% | 1,041,796 | 2.3% |
[ 0.0% - 0.5% ] 0.47% | 890,144 | 2.1% |
[ 0.5% - 1.0% ] 0.52% | 931,303 | 2.3% |
[ 0.5% - 1.0% ] 0.57% | 653,913 | 2.1% |
[ 0.5% - 1.0% ] 0.62% | 486,184 | 2.2% |
[ 0.5% - 1.0% ] 0.68% | 441,269 | 2.1% |
[ 0.5% - 1.0% ] 0.72% | 296,129 | 2.7% |
[ 0.5% - 1.0% ] 0.78% | 392,150 | 2.0% |
[ 0.5% - 1.0% ] 0.83% | 136,983 | 2.4% |
[ 0.5% - 1.0% ] 0.88% | 312,035 | 2.4% |
[ 0.5% - 1.0% ] 0.92% | 115,222 | 2.8% |
[ 0.5% - 1.0% ] 0.97% | 123,244 | 1.8% |
[ 1.0% - 1.5% ] 1.02% | 250,821 | 1.9% |
[ 1.0% - 1.5% ] 1.08% | 99,475 | 2.0% |
[ 1.0% - 1.5% ] 1.12% | 83,985 | 1.6% |
[ 1.0% - 1.5% ] 1.17% | 61,423 | 1.9% |
[ 1.0% - 1.5% ] 1.22% | 75,057 | 2.2% |
[ 1.0% - 1.5% ] 1.25% | 121,289 | 2.0% |
[ 1.0% - 1.5% ] 1.31% | 92,291 | 2.0% |
[ 1.0% - 1.5% ] 1.37% | 17,994 | 3.9% |
[ 1.0% - 1.5% ] 1.42% | 16,645 | 2.3% |
[ 1.0% - 1.5% ] 1.49% | 24,327 | 1.7% |
[ 1.5% - 2.0% ] 1.52% | 163,378 | 1.7% |
[ 1.5% - 2.0% ] 1.56% | 38,212 | 1.4% |
[ 1.5% - 2.0% ] 1.61% | 11,645 | 1.2% |
[ 1.5% - 2.0% ] 1.67% | 11,047 | 2.0% |
[ 1.5% - 2.0% ] 1.71% | 28,837 | 2.5% |
[ 1.5% - 2.0% ] 1.78% | 23,795 | 2.2% |
[ 1.5% - 2.0% ] 1.83% | 100,974 | 1.8% |
[ 1.5% - 2.0% ] 1.86% | 67,026 | 2.2% |
[ 1.5% - 2.0% ] 1.91% | 14,936 | 2.9% |
[ 1.5% - 2.0% ] 1.99% | 66,426 | 1.7% |
[ 2.0% - 2.5% ] 2.06% | 30,650 | 1.1% |
[ 2.0% - 2.5% ] 2.14% | 2,430 | 0.83% |
[ 2.0% - 2.5% ] 2.22% | 29,574 | 1.9% |
[ 2.0% - 2.5% ] 2.33% | 43,478 | 1.7% |
[ 2.0% - 2.5% ] 2.42% | 29,216 | 2.5% |
[ 2.5% - 3.0% ] 2.52% | 3,689 | 2.4% |
[ 2.5% - 3.0% ] 2.63% | 876 | 5.6% |
[ 2.5% - 3.0% ] 2.77% | 1,984 | 0.98% |
[ 2.5% - 3.0% ] 2.83% | 3,218 | 3.9% |
[ 2.5% - 3.0% ] 2.96% | 3,613 | 1.9% |
[ 3.0% - 3.5% ] 3.07% | 11,134 | 2.9% |
[ 3.0% - 3.5% ] 3.13% | 16,118 | 1.5% |
[ 3.0% - 3.5% ] 3.21% | 3,456 | 6.3% |
[ 3.0% - 3.5% ] 3.25% | 9,929 | 2.7% |
[ 3.0% - 3.5% ] 3.33% | 11,706 | 0.21% |
[ 3.0% - 3.5% ] 3.34% | 1,556 | 1.1% |
[ 3.0% - 3.5% ] 3.41% | 4,514 | 1.4% |
[ 3.0% - 3.5% ] 3.45% | 5,213 | 1.8% |
[ 3.5% - 4.0% ] 3.77% | 4,080 | 1.4% |
[ 3.5% - 4.0% ] 3.92% | 2,627 | 2.3% |
[ 4.0% - 4.5% ] 4.41% | 227 | 3.4% |
[ 4.5% - 5.0% ] 4.61% | 1,171 | 1.3% |
[ 4.5% - 5.0% ] 4.93% | 3,306 | 6.5% |
[ 5.0% - 5.5% ] 5.40% | 593 | 1.9% |
[ 5.5% - 6.0% ] 5.95% | 3,042 | 3.4% |
[ 8.0% - 8.5% ] 8.23% | 328 | 2.3% |
[ 9.5% - 10.0% ] 9.97% | 1,123 | 0.56% |