Bulgarian Female Disability
COMPARE
Bulgarian
Select to Compare
Female Disability
Bulgarian Female Disability
11.3%
DISABILITY | FEMALES
99.9/ 100
METRIC RATING
55th/ 347
METRIC RANK
Bulgarian Female Disability Correlation Chart
The statistical analysis conducted on geographies consisting of 205,628,726 people shows a weak positive correlation between the proportion of Bulgarians and percentage of females with a disability in the United States with a correlation coefficient (R) of 0.236 and weighted average of 11.3%. On average, for every 1% (one percent) increase in Bulgarians within a typical geography, there is an increase of 0.16% in percentage of females with a disability.
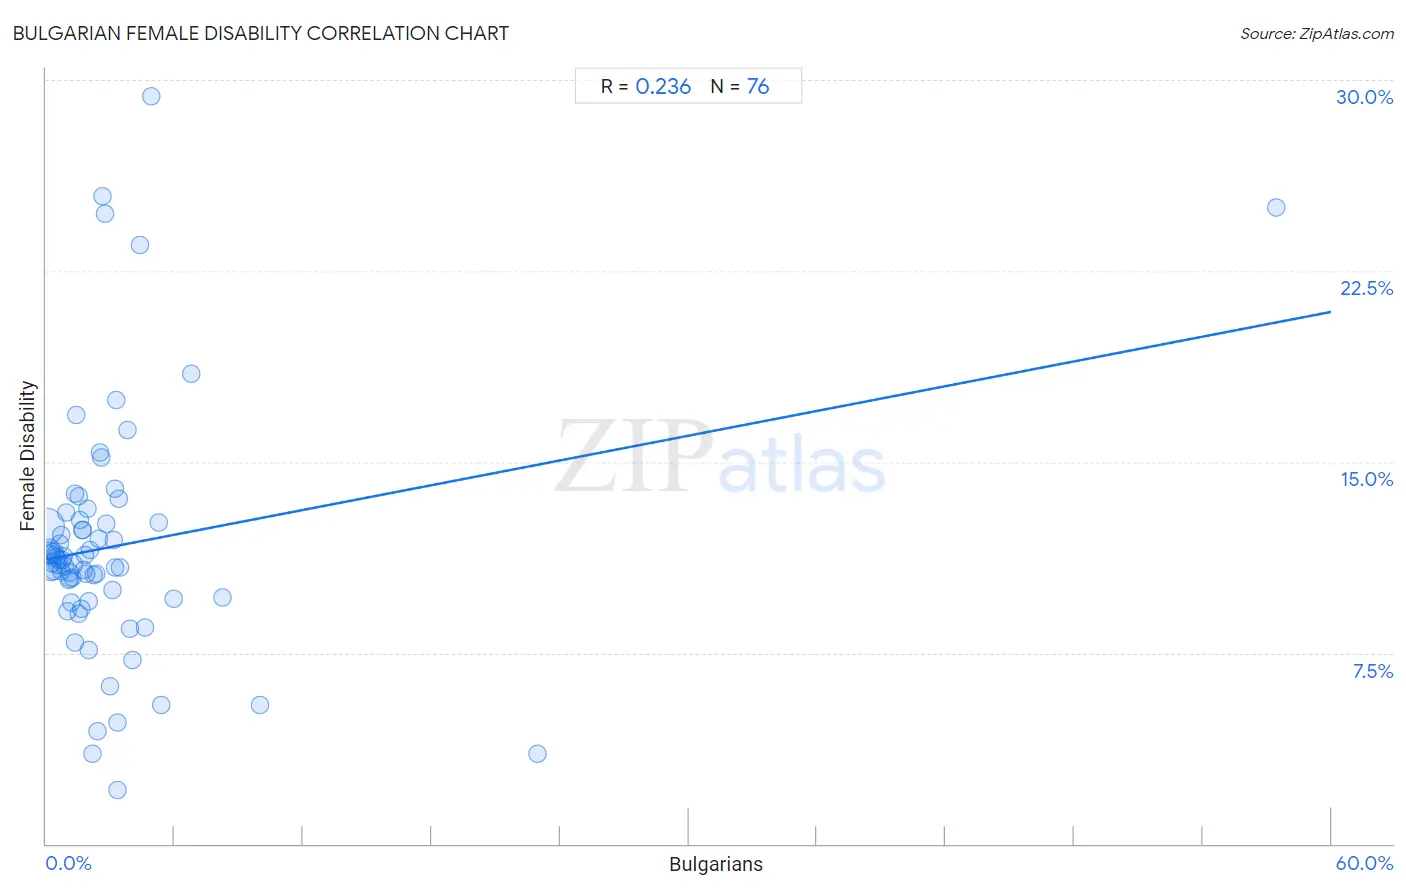
It is essential to understand that the correlation between the percentage of Bulgarians and percentage of females with a disability does not imply a direct cause-and-effect relationship. It remains uncertain whether the presence of Bulgarians influences an upward or downward trend in the level of percentage of females with a disability within an area, or if Bulgarians simply ended up residing in those areas with higher or lower levels of percentage of females with a disability due to other factors.
Demographics Similar to Bulgarians by Female Disability
In terms of female disability, the demographic groups most similar to Bulgarians are Peruvian (11.3%, a difference of 0.020%), Immigrants from Saudi Arabia (11.3%, a difference of 0.070%), Immigrants from Peru (11.3%, a difference of 0.12%), Taiwanese (11.4%, a difference of 0.23%), and Immigrants from Belgium (11.3%, a difference of 0.24%).
| Demographics | Rating | Rank | Female Disability |
| Zimbabweans | 100.0 /100 | #48 | Exceptional 11.3% |
| Tongans | 100.0 /100 | #49 | Exceptional 11.3% |
| Inupiat | 100.0 /100 | #50 | Exceptional 11.3% |
| Immigrants from Belgium | 100.0 /100 | #51 | Exceptional 11.3% |
| Immigrants from Peru | 99.9 /100 | #52 | Exceptional 11.3% |
| Immigrants from Saudi Arabia | 99.9 /100 | #53 | Exceptional 11.3% |
| Peruvians | 99.9 /100 | #54 | Exceptional 11.3% |
| Bulgarians | 99.9 /100 | #55 | Exceptional 11.3% |
| Taiwanese | 99.9 /100 | #56 | Exceptional 11.4% |
| South Americans | 99.9 /100 | #57 | Exceptional 11.4% |
| Laotians | 99.9 /100 | #58 | Exceptional 11.4% |
| Immigrants from Spain | 99.9 /100 | #59 | Exceptional 11.4% |
| Immigrants from Bulgaria | 99.9 /100 | #60 | Exceptional 11.4% |
| Immigrants from France | 99.9 /100 | #61 | Exceptional 11.4% |
| Sri Lankans | 99.9 /100 | #62 | Exceptional 11.4% |
Bulgarian Female Disability Correlation Summary
| Measurement | Bulgarian Data | Female Disability Data |
| Minimum | 0.025% | 2.1% |
| Maximum | 57.4% | 29.3% |
| Range | 57.4% | 27.2% |
| Mean | 3.3% | 11.7% |
| Median | 1.9% | 11.1% |
| Interquartile 25% (IQ1) | 0.94% | 9.6% |
| Interquartile 75% (IQ3) | 3.2% | 12.6% |
| Interquartile Range (IQR) | 2.3% | 2.9% |
| Standard Deviation (Sample) | 7.0% | 4.8% |
| Standard Deviation (Population) | 6.9% | 4.8% |
Correlation Details
| Bulgarian Percentile | Sample Size | Female Disability |
[ 0.0% - 0.5% ] 0.025% | 113,974,238 | 12.4% |
[ 0.0% - 0.5% ] 0.072% | 40,988,700 | 11.5% |
[ 0.0% - 0.5% ] 0.12% | 19,163,571 | 11.5% |
[ 0.0% - 0.5% ] 0.17% | 9,543,603 | 11.4% |
[ 0.0% - 0.5% ] 0.22% | 5,895,914 | 10.7% |
[ 0.0% - 0.5% ] 0.27% | 3,494,437 | 11.0% |
[ 0.0% - 0.5% ] 0.32% | 3,383,647 | 10.7% |
[ 0.0% - 0.5% ] 0.38% | 1,725,008 | 11.4% |
[ 0.0% - 0.5% ] 0.42% | 1,042,792 | 11.3% |
[ 0.0% - 0.5% ] 0.47% | 899,195 | 11.3% |
[ 0.5% - 1.0% ] 0.52% | 933,701 | 10.9% |
[ 0.5% - 1.0% ] 0.57% | 658,581 | 11.1% |
[ 0.5% - 1.0% ] 0.62% | 486,666 | 11.8% |
[ 0.5% - 1.0% ] 0.68% | 444,754 | 10.7% |
[ 0.5% - 1.0% ] 0.72% | 296,129 | 12.2% |
[ 0.5% - 1.0% ] 0.78% | 392,150 | 11.1% |
[ 0.5% - 1.0% ] 0.83% | 136,983 | 11.3% |
[ 0.5% - 1.0% ] 0.88% | 312,973 | 10.9% |
[ 0.5% - 1.0% ] 0.92% | 115,879 | 13.0% |
[ 0.5% - 1.0% ] 0.97% | 123,244 | 9.1% |
[ 1.0% - 1.5% ] 1.02% | 253,226 | 10.4% |
[ 1.0% - 1.5% ] 1.08% | 99,939 | 10.4% |
[ 1.0% - 1.5% ] 1.12% | 85,054 | 10.6% |
[ 1.0% - 1.5% ] 1.17% | 61,423 | 9.5% |
[ 1.0% - 1.5% ] 1.22% | 75,057 | 10.4% |
[ 1.0% - 1.5% ] 1.25% | 121,289 | 11.0% |
[ 1.0% - 1.5% ] 1.31% | 92,291 | 7.9% |
[ 1.0% - 1.5% ] 1.37% | 17,994 | 13.7% |
[ 1.0% - 1.5% ] 1.42% | 16,645 | 16.8% |
[ 1.0% - 1.5% ] 1.49% | 24,327 | 13.7% |
[ 1.5% - 2.0% ] 1.52% | 167,016 | 9.0% |
[ 1.5% - 2.0% ] 1.57% | 39,615 | 12.7% |
[ 1.5% - 2.0% ] 1.61% | 11,645 | 9.2% |
[ 1.5% - 2.0% ] 1.67% | 11,047 | 12.3% |
[ 1.5% - 2.0% ] 1.71% | 31,967 | 12.3% |
[ 1.5% - 2.0% ] 1.78% | 24,301 | 10.8% |
[ 1.5% - 2.0% ] 1.83% | 100,974 | 11.3% |
[ 1.5% - 2.0% ] 1.86% | 67,026 | 10.6% |
[ 1.5% - 2.0% ] 1.91% | 14,936 | 13.1% |
[ 1.5% - 2.0% ] 1.99% | 67,035 | 7.6% |
[ 2.0% - 2.5% ] 2.00% | 200 | 9.5% |
[ 2.0% - 2.5% ] 2.06% | 30,650 | 11.5% |
[ 2.0% - 2.5% ] 2.14% | 2,430 | 3.5% |
[ 2.0% - 2.5% ] 2.22% | 29,800 | 10.6% |
[ 2.0% - 2.5% ] 2.33% | 43,478 | 10.6% |
[ 2.0% - 2.5% ] 2.38% | 378 | 4.4% |
[ 2.0% - 2.5% ] 2.42% | 29,216 | 12.0% |
[ 2.5% - 3.0% ] 2.52% | 3,689 | 15.4% |
[ 2.5% - 3.0% ] 2.56% | 313 | 15.2% |
[ 2.5% - 3.0% ] 2.63% | 876 | 25.4% |
[ 2.5% - 3.0% ] 2.77% | 1,984 | 24.8% |
[ 2.5% - 3.0% ] 2.83% | 3,218 | 12.6% |
[ 2.5% - 3.0% ] 2.96% | 3,613 | 6.2% |
[ 3.0% - 3.5% ] 3.07% | 11,134 | 9.9% |
[ 3.0% - 3.5% ] 3.13% | 16,118 | 11.9% |
[ 3.0% - 3.5% ] 3.19% | 1,379 | 13.9% |
[ 3.0% - 3.5% ] 3.21% | 3,456 | 10.8% |
[ 3.0% - 3.5% ] 3.25% | 9,929 | 17.4% |
[ 3.0% - 3.5% ] 3.33% | 11,706 | 4.8% |
[ 3.0% - 3.5% ] 3.34% | 1,556 | 2.1% |
[ 3.0% - 3.5% ] 3.41% | 4,719 | 13.6% |
[ 3.0% - 3.5% ] 3.45% | 5,213 | 10.8% |
[ 3.5% - 4.0% ] 3.77% | 4,080 | 16.2% |
[ 3.5% - 4.0% ] 3.92% | 2,627 | 8.5% |
[ 4.0% - 4.5% ] 4.04% | 272 | 7.2% |
[ 4.0% - 4.5% ] 4.41% | 227 | 23.5% |
[ 4.5% - 5.0% ] 4.61% | 1,171 | 8.5% |
[ 4.5% - 5.0% ] 4.93% | 3,306 | 29.3% |
[ 5.0% - 5.5% ] 5.25% | 1,275 | 12.6% |
[ 5.0% - 5.5% ] 5.40% | 593 | 5.4% |
[ 5.5% - 6.0% ] 5.95% | 3,042 | 9.6% |
[ 6.5% - 7.0% ] 6.77% | 133 | 18.5% |
[ 8.0% - 8.5% ] 8.23% | 328 | 9.7% |
[ 9.5% - 10.0% ] 9.97% | 1,123 | 5.5% |
[ 22.5% - 23.0% ] 22.95% | 475 | 3.6% |
[ 57.0% - 57.5% ] 57.45% | 47 | 25.0% |