Bulgarian Unemployment Among Women with Children Ages 6 to 17 years

COMPARE

Bulgarian
Race
Ancestry
AfghanAfricanAlaska NativeAlaskan AthabascanAlbanianAleutAlsatianAmericanApacheArabArapahoArgentineanArmenianAssyrian/Chaldean/SyriacAustralianAustrianBahamianBangladeshiBarbadianBasqueBelgianBelizeanBermudanBhutaneseBlackfeetBolivianBrazilianBritishBritish West IndianBulgarianBurmeseCajunCambodianCanadianCape VerdeanCarpatho RusynCelticCentral AmericanCentral American IndianCherokeeCheyenneChickasawChileanChineseChippewaChoctawColombianColvilleComancheCosta RicanCreeCreekCroatianCrowCubanCypriotCzechCzechoslovakianDanishDelawareDominicanDutchDutch West IndianEastern EuropeanEcuadorianEgyptianEnglishEstonianEthiopianEuropeanFijianFilipinoFinnishFrenchFrench American IndianFrench CanadianGermanGerman RussianGhanaianGreekGuamanian/ChamorroGuatemalanGuyaneseHaitianHmongHonduranHopiHoumaHungarianIcelanderIndian (Asian)IndonesianInupiatIranianIraqiIrishIroquoisIsraeliItalianJamaicanJapaneseJordanianKenyanKiowaKoreanLaotianLatvianLebaneseLiberianLithuanianLumbeeLuxembourgerMacedonianMalaysianMalteseMarshalleseMenomineeMexicanMexican American IndianMongolianMoroccanNative HawaiianNavajoNepaleseNew ZealanderNicaraguanNigerianNorthern EuropeanNorwegianOkinawanOsageOttawaPaiutePakistaniPalestinianPanamanianParaguayanPennsylvania GermanPeruvianPimaPolishPortuguesePotawatomiPuebloPuerto RicanPuget Sound SalishRomanianRussianSalvadoranSamoanScandinavianScotch-IrishScottishSeminoleSenegaleseSerbianShoshoneSierra LeoneanSiouxSlavicSlovakSloveneSomaliSouth AfricanSouth AmericanSouth American IndianSoviet UnionSpaniardSpanishSpanish AmericanSpanish American IndianSri LankanSubsaharan AfricanSudaneseSwedishSwissSyrianTaiwaneseThaiTlingit-HaidaTohono O'OdhamTonganTrinidadian and TobagonianTsimshianTurkishU.S. Virgin IslanderUgandanUkrainianUruguayanUteVenezuelanVietnameseWelshWest IndianYakamaYaquiYugoslavianYumanYup'ikZimbabwean
Immigration
NonimmigrantsImmigrantsAfghanistanAfricaAlbaniaArgentinaArmeniaAsiaAustraliaAustriaBahamasBangladeshBarbadosBelarusBelgiumBelizeBoliviaBosnia and HerzegovinaBrazilBulgariaBurma/MyanmarCabo VerdeCambodiaCameroonCanadaCaribbeanCentral AmericaChileChinaColombiaCongoCosta RicaCroatiaCubaCzechoslovakiaDenmarkDominicaDominican RepublicEastern AfricaEastern AsiaEastern EuropeEcuadorEgyptEl SalvadorEnglandEritreaEthiopiaEuropeFijiFranceGermanyGhanaGreeceGrenadaGuatemalaGuyanaHaitiHondurasHong KongHungaryIndiaIndonesiaIranIraqIrelandIsraelItalyJamaicaJapanJordanKazakhstanKenyaKoreaKuwaitLaosLatin AmericaLatviaLebanonLiberiaLithuaniaMalaysiaMexicoMicronesiaMiddle AfricaMoldovaMoroccoNepalNetherlandsNicaraguaNigeriaNorth AmericaNorth MacedoniaNorthern AfricaNorthern EuropeNorwayOceaniaPakistanPanamaPeruPhilippinesPolandPortugalRomaniaRussiaSaudi ArabiaScotlandSenegalSerbiaSierra LeoneSingaporeSomaliaSouth AfricaSouth AmericaSouth Central AsiaSouth Eastern AsiaSouthern EuropeSpainSri LankaSt. Vincent and the GrenadinesSudanSwedenSwitzerlandSyriaTaiwanThailandTrinidad and TobagoTurkeyUgandaUkraineUruguayUzbekistanVenezuelaVietnamWest IndiesWestern AfricaWestern AsiaWestern EuropeYemenZaireZimbabweAzores
Select to Compare
Race
Ancestry
AfghanAfricanAlaska NativeAlaskan AthabascanAlbanianAleutAlsatianAmericanApacheArabArapahoArgentineanArmenianAssyrian/Chaldean/SyriacAustralianAustrianBahamianBangladeshiBarbadianBasqueBelgianBelizeanBermudanBhutaneseBlackfeetBolivianBrazilianBritishBritish West IndianBurmeseCajunCambodianCanadianCape VerdeanCarpatho RusynCelticCentral AmericanCentral American IndianCherokeeCheyenneChickasawChileanChineseChippewaChoctawColombianColvilleComancheCosta RicanCreeCreekCroatianCrowCubanCypriotCzechCzechoslovakianDanishDelawareDominicanDutchDutch West IndianEastern EuropeanEcuadorianEgyptianEnglishEstonianEthiopianEuropeanFijianFilipinoFinnishFrenchFrench American IndianFrench CanadianGermanGerman RussianGhanaianGreekGuamanian/ChamorroGuatemalanGuyaneseHaitianHmongHonduranHopiHoumaHungarianIcelanderIndian (Asian)IndonesianInupiatIranianIraqiIrishIroquoisIsraeliItalianJamaicanJapaneseJordanianKenyanKiowaKoreanLaotianLatvianLebaneseLiberianLithuanianLumbeeLuxembourgerMacedonianMalaysianMalteseMarshalleseMenomineeMexicanMexican American IndianMongolianMoroccanNative HawaiianNavajoNepaleseNew ZealanderNicaraguanNigerianNorthern EuropeanNorwegianOkinawanOsageOttawaPaiutePakistaniPalestinianPanamanianParaguayanPennsylvania GermanPeruvianPimaPolishPortuguesePotawatomiPuebloPuerto RicanPuget Sound SalishRomanianRussianSalvadoranSamoanScandinavianScotch-IrishScottishSeminoleSenegaleseSerbianShoshoneSierra LeoneanSiouxSlavicSlovakSloveneSomaliSouth AfricanSouth AmericanSouth American IndianSoviet UnionSpaniardSpanishSpanish AmericanSpanish American IndianSri LankanSubsaharan AfricanSudaneseSwedishSwissSyrianTaiwaneseThaiTlingit-HaidaTohono O'OdhamTonganTrinidadian and TobagonianTsimshianTurkishU.S. Virgin IslanderUgandanUkrainianUruguayanUteVenezuelanVietnameseWelshWest IndianYakamaYaquiYugoslavianYumanYup'ikZimbabwean
Immigration
NonimmigrantsImmigrantsAfghanistanAfricaAlbaniaArgentinaArmeniaAsiaAustraliaAustriaBahamasBangladeshBarbadosBelarusBelgiumBelizeBoliviaBosnia and HerzegovinaBrazilBulgariaBurma/MyanmarCabo VerdeCambodiaCameroonCanadaCaribbeanCentral AmericaChileChinaColombiaCongoCosta RicaCroatiaCubaCzechoslovakiaDenmarkDominicaDominican RepublicEastern AfricaEastern AsiaEastern EuropeEcuadorEgyptEl SalvadorEnglandEritreaEthiopiaEuropeFijiFranceGermanyGhanaGreeceGrenadaGuatemalaGuyanaHaitiHondurasHong KongHungaryIndiaIndonesiaIranIraqIrelandIsraelItalyJamaicaJapanJordanKazakhstanKenyaKoreaKuwaitLaosLatin AmericaLatviaLebanonLiberiaLithuaniaMalaysiaMexicoMicronesiaMiddle AfricaMoldovaMoroccoNepalNetherlandsNicaraguaNigeriaNorth AmericaNorth MacedoniaNorthern AfricaNorthern EuropeNorwayOceaniaPakistanPanamaPeruPhilippinesPolandPortugalRomaniaRussiaSaudi ArabiaScotlandSenegalSerbiaSierra LeoneSingaporeSomaliaSouth AfricaSouth AmericaSouth Central AsiaSouth Eastern AsiaSouthern EuropeSpainSri LankaSt. Vincent and the GrenadinesSudanSwedenSwitzerlandSyriaTaiwanThailandTrinidad and TobagoTurkeyUgandaUkraineUruguayUzbekistanVenezuelaVietnamWest IndiesWestern AfricaWestern AsiaWestern EuropeYemenZaireZimbabweAzores
Unemployment Among Women with Children Ages 6 to 17 years
Income
Poverty
Unemployment
Labor Participation
Family Structure
Vehicle Availability
Education Level
Disability

Bulgarian Unemployment Among Women with Children Ages 6 to 17 years
Exceptional

8.4%
UNEMPLOYMENT | WOMEN W/ CHILDREN 6 TO 17
99.5/ 100
METRIC RATING
83rd/ 347
METRIC RANK

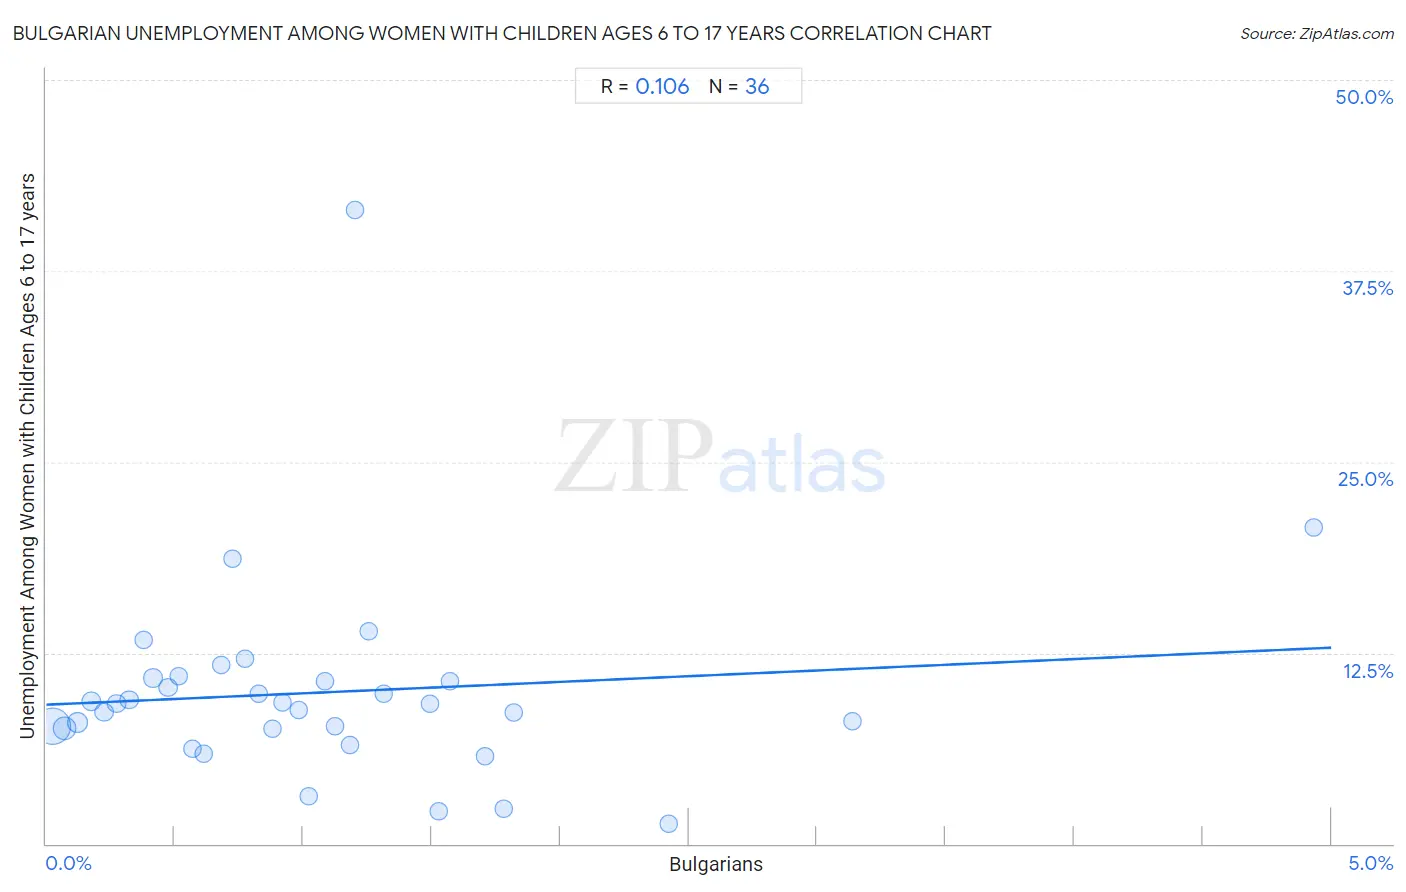
Bulgarian Unemployment Among Women with Children Ages 6 to 17 years Correlation Chart

The statistical analysis conducted on geographies consisting of 160,812,255 people shows a poor positive correlation between the proportion of Bulgarians and unemployment rate among women with children between the ages 6 and 17 in the United States with a correlation coefficient (R) of 0.106 and weighted average of 8.4%. On average, for every 1% (one percent) increase in Bulgarians within a typical geography, there is an increase of 0.75% in unemployment rate among women with children between the ages 6 and 17.
Bulgarian Unemployment Among Women with Children Ages 6 to 17 years
It is essential to understand that the correlation between the percentage of Bulgarians and unemployment rate among women with children between the ages 6 and 17 does not imply a direct cause-and-effect relationship. It remains uncertain whether the presence of Bulgarians influences an upward or downward trend in the level of unemployment rate among women with children between the ages 6 and 17 within an area, or if Bulgarians simply ended up residing in those areas with higher or lower levels of unemployment rate among women with children between the ages 6 and 17 due to other factors.

Demographics Similar to Bulgarians by Unemployment Among Women with Children Ages 6 to 17 years

In terms of unemployment among women with children ages 6 to 17 years, the demographic groups most similar to Bulgarians are Japanese (8.4%, a difference of 0.12%), Cypriot (8.4%, a difference of 0.16%), Immigrants from North Macedonia (8.5%, a difference of 0.16%), Immigrants from Bolivia (8.4%, a difference of 0.19%), and Alaskan Athabascan (8.5%, a difference of 0.30%).
DemographicsRating | RankUnemployment Among Women with Children Ages 6 to 17 years
Immigrants from Moldova
99.7
/100
|
#76
Exceptional
8.4%
Iraqis
99.7
/100
|
#77
Exceptional
8.4%
Pakistanis
99.6
/100
|
#78
Exceptional
8.4%
Mongolians
99.6
/100
|
#79
Exceptional
8.4%
Immigrants from Belarus
99.6
/100
|
#80
Exceptional
8.4%
Immigrants from Bolivia
99.6
/100
|
#81
Exceptional
8.4%
Cypriots
99.6
/100
|
#82
Exceptional
8.4%
Bulgarians
99.5
/100
|
#83
Exceptional
8.4%
Japanese
99.5
/100
|
#84
Exceptional
8.4%
Immigrants from North Macedonia
99.4
/100
|
#85
Exceptional
8.5%
Alaskan Athabascans
99.4
/100
|
#86
Exceptional
8.5%
Immigrants from Israel
99.1
/100
|
#87
Exceptional
8.5%
Immigrants from Vietnam
99.1
/100
|
#88
Exceptional
8.5%
Paiute
99.1
/100
|
#89
Exceptional
8.5%
Yugoslavians
99.0
/100
|
#90
Exceptional
8.5%

Bulgarian Unemployment Among Women with Children Ages 6 to 17 years Correlation Summary

MeasurementBulgarian DataUnemployment Among Women with Children Ages 6 to 17 years Data
Minimum0.025%1.3%
Maximum4.9%41.5%
Range4.9%40.2%
Mean1.1%9.9%
Median0.90%9.2%
Interquartile 25% (IQ1)0.44%7.5%
Interquartile 75% (IQ3)1.4%10.7%
Interquartile Range (IQR)0.96%3.2%
Standard Deviation (Sample)0.95%6.7%
Standard Deviation (Population)0.93%6.6%

Correlation Details

Bulgarian PercentileSample SizeUnemployment Among Women with Children Ages 6 to 17 years
[
0.0%
-
0.5%
]
0.025%
99,196,5827.7%
[
0.0%
-
0.5%
]
0.072%
30,710,3227.5%
[
0.0%
-
0.5%
]
0.12%
13,217,8588.0%
[
0.0%
-
0.5%
]
0.17%
5,939,6969.3%
[
0.0%
-
0.5%
]
0.22%
3,395,7368.6%
[
0.0%
-
0.5%
]
0.27%
2,072,2569.2%
[
0.0%
-
0.5%
]
0.32%
2,104,9229.4%
[
0.0%
-
0.5%
]
0.38%
852,79513.4%
[
0.0%
-
0.5%
]
0.42%
655,59410.8%
[
0.0%
-
0.5%
]
0.47%
353,91310.2%
[
0.5%
-
1.0%
]
0.52%
489,16711.0%
[
0.5%
-
1.0%
]
0.57%
303,2956.3%
[
0.5%
-
1.0%
]
0.61%
127,4185.9%
[
0.5%
-
1.0%
]
0.68%
235,17511.7%
[
0.5%
-
1.0%
]
0.73%
85,00318.6%
[
0.5%
-
1.0%
]
0.77%
104,75712.1%
[
0.5%
-
1.0%
]
0.83%
90,8949.8%
[
0.5%
-
1.0%
]
0.88%
142,7607.5%
[
0.5%
-
1.0%
]
0.92%
58,4099.3%
[
0.5%
-
1.0%
]
0.98%
63,3988.8%
[
1.0%
-
1.5%
]
1.02%
151,0883.1%
[
1.0%
-
1.5%
]
1.09%
51,65310.6%
[
1.0%
-
1.5%
]
1.13%
40,8587.7%
[
1.0%
-
1.5%
]
1.18%
17,1456.4%
[
1.0%
-
1.5%
]
1.20%
6,42141.5%
[
1.0%
-
1.5%
]
1.26%
24,18613.9%
[
1.0%
-
1.5%
]
1.31%
85,8019.8%
[
1.0%
-
1.5%
]
1.49%
24,0549.2%
[
1.5%
-
2.0%
]
1.53%
86,4212.1%
[
1.5%
-
2.0%
]
1.57%
22,86310.6%
[
1.5%
-
2.0%
]
1.71%
27,2045.7%
[
1.5%
-
2.0%
]
1.78%
20,7972.3%
[
1.5%
-
2.0%
]
1.82%
7,1018.6%
[
2.0%
-
2.5%
]
2.42%
29,2161.3%
[
3.0%
-
3.5%
]
3.14%
14,1918.0%
[
4.5%
-
5.0%
]
4.93%
3,30620.7%