Bulgarian 4 or more Vehicles in Household
COMPARE
Bulgarian
Select to Compare
4 or more Vehicles in Household
Bulgarian 4 or more Vehicles in Household
5.8%
4+ VEHICLES AVAILABLE
3.1/ 100
METRIC RATING
245th/ 347
METRIC RANK
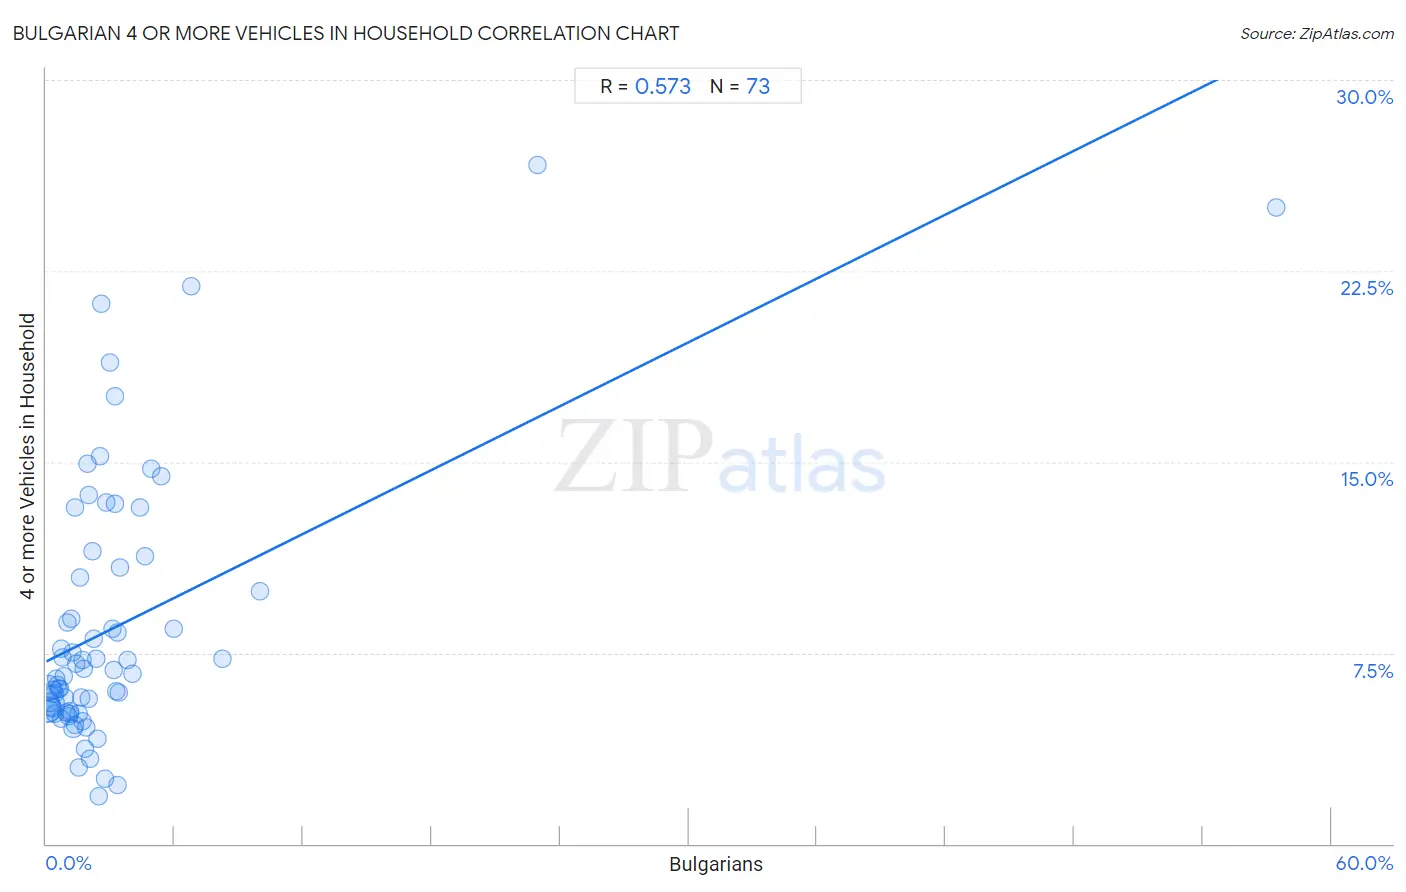
Bulgarian 4 or more Vehicles in Household Correlation Chart
The statistical analysis conducted on geographies consisting of 205,001,744 people shows a substantial positive correlation between the proportion of Bulgarians and percentage of households with 4 or more vehicles available in the United States with a correlation coefficient (R) of 0.573 and weighted average of 5.8%. On average, for every 1% (one percent) increase in Bulgarians within a typical geography, there is an increase of 0.42% in percentage of households with 4 or more vehicles available.
It is essential to understand that the correlation between the percentage of Bulgarians and percentage of households with 4 or more vehicles available does not imply a direct cause-and-effect relationship. It remains uncertain whether the presence of Bulgarians influences an upward or downward trend in the level of percentage of households with 4 or more vehicles available within an area, or if Bulgarians simply ended up residing in those areas with higher or lower levels of percentage of households with 4 or more vehicles available due to other factors.
Demographics Similar to Bulgarians by 4 or more Vehicles in Household
In terms of 4 or more vehicles in household, the demographic groups most similar to Bulgarians are Ethiopian (5.8%, a difference of 0.040%), Immigrants from Czechoslovakia (5.8%, a difference of 0.050%), Immigrants from Middle Africa (5.8%, a difference of 0.24%), Mongolian (5.8%, a difference of 0.45%), and Immigrants from Poland (5.8%, a difference of 0.54%).
| Demographics | Rating | Rank | 4 or more Vehicles in Household |
| Immigrants from Belgium | 4.0 /100 | #238 | Tragic 5.8% |
| Immigrants from Australia | 3.8 /100 | #239 | Tragic 5.8% |
| Immigrants from Poland | 3.8 /100 | #240 | Tragic 5.8% |
| Mongolians | 3.7 /100 | #241 | Tragic 5.8% |
| Immigrants from Middle Africa | 3.4 /100 | #242 | Tragic 5.8% |
| Immigrants from Czechoslovakia | 3.2 /100 | #243 | Tragic 5.8% |
| Ethiopians | 3.2 /100 | #244 | Tragic 5.8% |
| Bulgarians | 3.1 /100 | #245 | Tragic 5.8% |
| Immigrants from North Macedonia | 2.5 /100 | #246 | Tragic 5.7% |
| Immigrants from Ethiopia | 2.4 /100 | #247 | Tragic 5.7% |
| Immigrants from Eastern Africa | 2.4 /100 | #248 | Tragic 5.7% |
| Immigrants from Southern Europe | 2.3 /100 | #249 | Tragic 5.7% |
| Immigrants from Europe | 2.3 /100 | #250 | Tragic 5.7% |
| Ugandans | 2.2 /100 | #251 | Tragic 5.7% |
| Sub-Saharan Africans | 2.1 /100 | #252 | Tragic 5.7% |
Bulgarian 4 or more Vehicles in Household Correlation Summary
| Measurement | Bulgarian Data | 4 or more Vehicles in Household Data |
| Minimum | 0.025% | 1.9% |
| Maximum | 57.4% | 26.7% |
| Range | 57.4% | 24.8% |
| Mean | 3.2% | 8.5% |
| Median | 1.8% | 6.7% |
| Interquartile 25% (IQ1) | 0.90% | 5.2% |
| Interquartile 75% (IQ3) | 3.2% | 10.6% |
| Interquartile Range (IQR) | 2.3% | 5.5% |
| Standard Deviation (Sample) | 7.1% | 5.2% |
| Standard Deviation (Population) | 7.1% | 5.2% |
Correlation Details
| Bulgarian Percentile | Sample Size | 4 or more Vehicles in Household |
[ 0.0% - 0.5% ] 0.025% | 113,794,645 | 5.5% |
[ 0.0% - 0.5% ] 0.072% | 40,812,294 | 6.1% |
[ 0.0% - 0.5% ] 0.12% | 19,059,620 | 5.2% |
[ 0.0% - 0.5% ] 0.17% | 9,507,403 | 5.5% |
[ 0.0% - 0.5% ] 0.22% | 5,861,557 | 5.4% |
[ 0.0% - 0.5% ] 0.27% | 3,483,344 | 5.3% |
[ 0.0% - 0.5% ] 0.32% | 3,379,801 | 6.0% |
[ 0.0% - 0.5% ] 0.38% | 1,724,225 | 5.9% |
[ 0.0% - 0.5% ] 0.42% | 1,028,782 | 5.1% |
[ 0.0% - 0.5% ] 0.47% | 875,812 | 6.5% |
[ 0.5% - 1.0% ] 0.52% | 930,561 | 6.3% |
[ 0.5% - 1.0% ] 0.57% | 656,281 | 6.1% |
[ 0.5% - 1.0% ] 0.62% | 481,853 | 6.1% |
[ 0.5% - 1.0% ] 0.68% | 444,754 | 4.9% |
[ 0.5% - 1.0% ] 0.72% | 294,908 | 7.7% |
[ 0.5% - 1.0% ] 0.78% | 375,830 | 7.3% |
[ 0.5% - 1.0% ] 0.83% | 136,983 | 6.6% |
[ 0.5% - 1.0% ] 0.88% | 312,502 | 5.7% |
[ 0.5% - 1.0% ] 0.92% | 115,222 | 5.2% |
[ 0.5% - 1.0% ] 0.97% | 123,244 | 8.7% |
[ 1.0% - 1.5% ] 1.02% | 253,226 | 5.0% |
[ 1.0% - 1.5% ] 1.08% | 98,424 | 5.2% |
[ 1.0% - 1.5% ] 1.13% | 76,747 | 5.1% |
[ 1.0% - 1.5% ] 1.17% | 61,423 | 8.8% |
[ 1.0% - 1.5% ] 1.22% | 75,057 | 7.5% |
[ 1.0% - 1.5% ] 1.25% | 120,821 | 4.5% |
[ 1.0% - 1.5% ] 1.31% | 92,291 | 4.7% |
[ 1.0% - 1.5% ] 1.37% | 17,994 | 13.2% |
[ 1.0% - 1.5% ] 1.42% | 16,645 | 7.1% |
[ 1.0% - 1.5% ] 1.49% | 24,327 | 5.1% |
[ 1.5% - 2.0% ] 1.52% | 168,077 | 3.0% |
[ 1.5% - 2.0% ] 1.57% | 39,615 | 10.4% |
[ 1.5% - 2.0% ] 1.61% | 11,645 | 5.7% |
[ 1.5% - 2.0% ] 1.67% | 11,047 | 4.8% |
[ 1.5% - 2.0% ] 1.71% | 31,967 | 7.2% |
[ 1.5% - 2.0% ] 1.78% | 24,301 | 6.9% |
[ 1.5% - 2.0% ] 1.83% | 100,974 | 3.7% |
[ 1.5% - 2.0% ] 1.86% | 67,026 | 4.5% |
[ 1.5% - 2.0% ] 1.91% | 14,936 | 14.9% |
[ 1.5% - 2.0% ] 1.99% | 67,035 | 5.7% |
[ 2.0% - 2.5% ] 2.00% | 200 | 13.7% |
[ 2.0% - 2.5% ] 2.06% | 30,650 | 3.4% |
[ 2.0% - 2.5% ] 2.14% | 2,430 | 11.5% |
[ 2.0% - 2.5% ] 2.22% | 29,574 | 8.1% |
[ 2.0% - 2.5% ] 2.33% | 43,478 | 7.3% |
[ 2.0% - 2.5% ] 2.38% | 378 | 4.1% |
[ 2.0% - 2.5% ] 2.42% | 29,216 | 1.9% |
[ 2.5% - 3.0% ] 2.52% | 3,689 | 15.2% |
[ 2.5% - 3.0% ] 2.56% | 313 | 21.2% |
[ 2.5% - 3.0% ] 2.77% | 1,984 | 2.6% |
[ 2.5% - 3.0% ] 2.83% | 3,218 | 13.4% |
[ 2.5% - 3.0% ] 2.96% | 3,613 | 18.9% |
[ 3.0% - 3.5% ] 3.07% | 11,134 | 8.4% |
[ 3.0% - 3.5% ] 3.13% | 16,118 | 6.8% |
[ 3.0% - 3.5% ] 3.19% | 1,379 | 17.6% |
[ 3.0% - 3.5% ] 3.21% | 3,456 | 13.3% |
[ 3.0% - 3.5% ] 3.25% | 9,929 | 6.0% |
[ 3.0% - 3.5% ] 3.33% | 11,706 | 8.3% |
[ 3.0% - 3.5% ] 3.34% | 1,556 | 2.3% |
[ 3.0% - 3.5% ] 3.41% | 4,514 | 5.9% |
[ 3.0% - 3.5% ] 3.45% | 5,213 | 10.8% |
[ 3.5% - 4.0% ] 3.77% | 4,080 | 7.2% |
[ 4.0% - 4.5% ] 4.04% | 272 | 6.7% |
[ 4.0% - 4.5% ] 4.41% | 227 | 13.2% |
[ 4.5% - 5.0% ] 4.61% | 1,171 | 11.3% |
[ 4.5% - 5.0% ] 4.93% | 3,306 | 14.7% |
[ 5.0% - 5.5% ] 5.40% | 593 | 14.4% |
[ 5.5% - 6.0% ] 5.95% | 3,042 | 8.4% |
[ 6.5% - 7.0% ] 6.77% | 133 | 21.9% |
[ 8.0% - 8.5% ] 8.23% | 328 | 7.3% |
[ 9.5% - 10.0% ] 9.97% | 1,123 | 9.9% |
[ 22.5% - 23.0% ] 22.95% | 475 | 26.7% |
[ 57.0% - 57.5% ] 57.45% | 47 | 25.0% |