Brazilian Married-Couple Family Poverty
COMPARE
Brazilian
Select to Compare
Married-Couple Family Poverty
Brazilian Married-Couple Family Poverty
5.0%
POVERTY | MARRIED-COUPLE FAMILIES
78.3/ 100
METRIC RATING
150th/ 347
METRIC RANK
Brazilian Married-Couple Family Poverty Correlation Chart
The statistical analysis conducted on geographies consisting of 321,555,687 people shows a weak positive correlation between the proportion of Brazilians and poverty level among married-couple families in the United States with a correlation coefficient (R) of 0.226 and weighted average of 5.0%. On average, for every 1% (one percent) increase in Brazilians within a typical geography, there is an increase of 0.13% in poverty level among married-couple families.
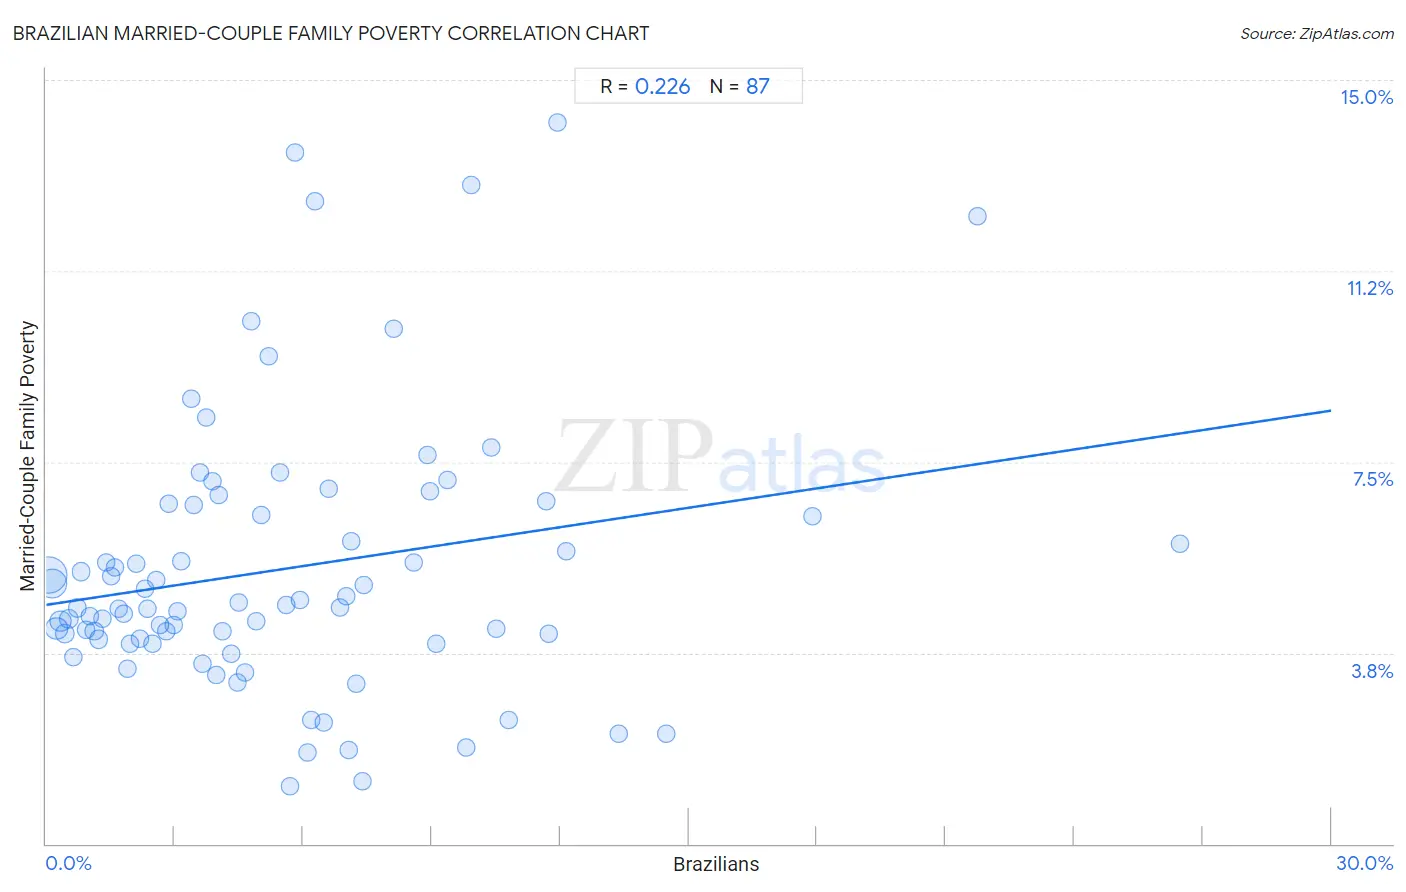
It is essential to understand that the correlation between the percentage of Brazilians and poverty level among married-couple families does not imply a direct cause-and-effect relationship. It remains uncertain whether the presence of Brazilians influences an upward or downward trend in the level of poverty level among married-couple families within an area, or if Brazilians simply ended up residing in those areas with higher or lower levels of poverty level among married-couple families due to other factors.
Demographics Similar to Brazilians by Married-Couple Family Poverty
In terms of married-couple family poverty, the demographic groups most similar to Brazilians are Immigrants from Oceania (5.0%, a difference of 0.050%), Syrian (5.0%, a difference of 0.080%), Immigrants from Russia (5.0%, a difference of 0.080%), Immigrants from Cameroon (5.0%, a difference of 0.17%), and Albanian (5.0%, a difference of 0.19%).
| Demographics | Rating | Rank | Married-Couple Family Poverty |
| Immigrants from Egypt | 83.4 /100 | #143 | Excellent 5.0% |
| Hmong | 83.2 /100 | #144 | Excellent 5.0% |
| Immigrants from Spain | 79.9 /100 | #145 | Good 5.0% |
| Mongolians | 79.8 /100 | #146 | Good 5.0% |
| Syrians | 78.7 /100 | #147 | Good 5.0% |
| Immigrants from Russia | 78.7 /100 | #148 | Good 5.0% |
| Immigrants from Oceania | 78.6 /100 | #149 | Good 5.0% |
| Brazilians | 78.3 /100 | #150 | Good 5.0% |
| Immigrants from Cameroon | 77.3 /100 | #151 | Good 5.0% |
| Albanians | 77.2 /100 | #152 | Good 5.0% |
| Immigrants from Kuwait | 76.3 /100 | #153 | Good 5.0% |
| Delaware | 73.7 /100 | #154 | Good 5.1% |
| Immigrants from Ethiopia | 72.4 /100 | #155 | Good 5.1% |
| Sri Lankans | 72.2 /100 | #156 | Good 5.1% |
| Argentineans | 70.7 /100 | #157 | Good 5.1% |
Brazilian Married-Couple Family Poverty Correlation Summary
| Measurement | Brazilian Data | Married-Couple Family Poverty Data |
| Minimum | 0.046% | 1.1% |
| Maximum | 26.5% | 14.2% |
| Range | 26.4% | 13.0% |
| Mean | 5.5% | 5.4% |
| Median | 4.5% | 4.6% |
| Interquartile 25% (IQ1) | 2.1% | 4.0% |
| Interquartile 75% (IQ3) | 7.4% | 6.6% |
| Interquartile Range (IQR) | 5.3% | 2.6% |
| Standard Deviation (Sample) | 4.7% | 2.7% |
| Standard Deviation (Population) | 4.7% | 2.7% |
Correlation Details
| Brazilian Percentile | Sample Size | Married-Couple Family Poverty |
[ 0.0% - 0.5% ] 0.046% | 136,744,523 | 5.3% |
[ 0.0% - 0.5% ] 0.14% | 85,073,571 | 5.1% |
[ 0.0% - 0.5% ] 0.24% | 31,448,920 | 4.2% |
[ 0.0% - 0.5% ] 0.33% | 19,560,101 | 4.4% |
[ 0.0% - 0.5% ] 0.43% | 11,962,961 | 4.1% |
[ 0.5% - 1.0% ] 0.53% | 7,447,382 | 4.4% |
[ 0.5% - 1.0% ] 0.63% | 5,546,812 | 3.7% |
[ 0.5% - 1.0% ] 0.73% | 2,561,143 | 4.6% |
[ 0.5% - 1.0% ] 0.81% | 2,981,770 | 5.3% |
[ 0.5% - 1.0% ] 0.92% | 2,434,055 | 4.2% |
[ 1.0% - 1.5% ] 1.02% | 1,955,399 | 4.5% |
[ 1.0% - 1.5% ] 1.12% | 1,574,299 | 4.2% |
[ 1.0% - 1.5% ] 1.21% | 1,400,967 | 4.0% |
[ 1.0% - 1.5% ] 1.31% | 938,651 | 4.4% |
[ 1.0% - 1.5% ] 1.41% | 804,365 | 5.5% |
[ 1.5% - 2.0% ] 1.50% | 775,832 | 5.3% |
[ 1.5% - 2.0% ] 1.60% | 571,597 | 5.4% |
[ 1.5% - 2.0% ] 1.69% | 1,001,907 | 4.6% |
[ 1.5% - 2.0% ] 1.81% | 235,776 | 4.5% |
[ 1.5% - 2.0% ] 1.90% | 479,248 | 3.4% |
[ 1.5% - 2.0% ] 1.97% | 141,302 | 3.9% |
[ 2.0% - 2.5% ] 2.11% | 727,276 | 5.5% |
[ 2.0% - 2.5% ] 2.18% | 439,215 | 4.0% |
[ 2.0% - 2.5% ] 2.30% | 357,962 | 5.0% |
[ 2.0% - 2.5% ] 2.37% | 292,816 | 4.6% |
[ 2.0% - 2.5% ] 2.47% | 135,898 | 3.9% |
[ 2.5% - 3.0% ] 2.56% | 190,722 | 5.2% |
[ 2.5% - 3.0% ] 2.67% | 121,638 | 4.3% |
[ 2.5% - 3.0% ] 2.79% | 57,124 | 4.2% |
[ 2.5% - 3.0% ] 2.87% | 164,649 | 6.7% |
[ 2.5% - 3.0% ] 2.98% | 182,701 | 4.3% |
[ 3.0% - 3.5% ] 3.06% | 54,832 | 4.6% |
[ 3.0% - 3.5% ] 3.16% | 60,860 | 5.6% |
[ 3.0% - 3.5% ] 3.37% | 104,292 | 8.7% |
[ 3.0% - 3.5% ] 3.45% | 239,108 | 6.6% |
[ 3.5% - 4.0% ] 3.58% | 254,017 | 7.3% |
[ 3.5% - 4.0% ] 3.65% | 142,758 | 3.5% |
[ 3.5% - 4.0% ] 3.74% | 170,308 | 8.4% |
[ 3.5% - 4.0% ] 3.87% | 31,709 | 7.1% |
[ 3.5% - 4.0% ] 3.96% | 94,518 | 3.3% |
[ 4.0% - 4.5% ] 4.03% | 141,718 | 6.9% |
[ 4.0% - 4.5% ] 4.13% | 28,649 | 4.2% |
[ 4.0% - 4.5% ] 4.32% | 61,701 | 3.7% |
[ 4.0% - 4.5% ] 4.47% | 42,045 | 3.2% |
[ 4.0% - 4.5% ] 4.50% | 122,618 | 4.7% |
[ 4.5% - 5.0% ] 4.64% | 12,532 | 3.4% |
[ 4.5% - 5.0% ] 4.79% | 321,033 | 10.3% |
[ 4.5% - 5.0% ] 4.90% | 9,246 | 4.4% |
[ 5.0% - 5.5% ] 5.02% | 4,762 | 6.5% |
[ 5.0% - 5.5% ] 5.18% | 29,576 | 9.6% |
[ 5.0% - 5.5% ] 5.46% | 1,924 | 7.3% |
[ 5.5% - 6.0% ] 5.61% | 144,030 | 4.7% |
[ 5.5% - 6.0% ] 5.70% | 20,668 | 1.1% |
[ 5.5% - 6.0% ] 5.82% | 3,783 | 13.6% |
[ 5.5% - 6.0% ] 5.93% | 843 | 4.8% |
[ 6.0% - 6.5% ] 6.09% | 10,623 | 1.8% |
[ 6.0% - 6.5% ] 6.20% | 742 | 2.4% |
[ 6.0% - 6.5% ] 6.26% | 6,406 | 12.6% |
[ 6.0% - 6.5% ] 6.48% | 48,922 | 2.4% |
[ 6.5% - 7.0% ] 6.59% | 56,891 | 7.0% |
[ 6.5% - 7.0% ] 6.85% | 70,451 | 4.6% |
[ 6.5% - 7.0% ] 7.00% | 46,938 | 4.9% |
[ 7.0% - 7.5% ] 7.05% | 241 | 1.9% |
[ 7.0% - 7.5% ] 7.12% | 2,330 | 5.9% |
[ 7.0% - 7.5% ] 7.25% | 33,691 | 3.1% |
[ 7.0% - 7.5% ] 7.37% | 17,214 | 1.2% |
[ 7.0% - 7.5% ] 7.43% | 55,011 | 5.1% |
[ 8.0% - 8.5% ] 8.10% | 49,890 | 10.1% |
[ 8.5% - 9.0% ] 8.59% | 32,076 | 5.5% |
[ 8.5% - 9.0% ] 8.89% | 118,546 | 7.6% |
[ 8.5% - 9.0% ] 8.96% | 31,932 | 6.9% |
[ 9.0% - 9.5% ] 9.11% | 2,317 | 3.9% |
[ 9.0% - 9.5% ] 9.37% | 97,370 | 7.1% |
[ 9.5% - 10.0% ] 9.81% | 11,551 | 1.9% |
[ 9.5% - 10.0% ] 9.91% | 13,154 | 12.9% |
[ 10.0% - 10.5% ] 10.38% | 60,009 | 7.8% |
[ 10.5% - 11.0% ] 10.51% | 1,580 | 4.2% |
[ 10.5% - 11.0% ] 10.79% | 82,782 | 2.4% |
[ 11.5% - 12.0% ] 11.68% | 50,112 | 6.7% |
[ 11.5% - 12.0% ] 11.74% | 71,805 | 4.1% |
[ 11.5% - 12.0% ] 11.93% | 3,589 | 14.2% |
[ 12.0% - 12.5% ] 12.14% | 17,178 | 5.7% |
[ 13.0% - 13.5% ] 13.38% | 30,411 | 2.2% |
[ 14.0% - 14.5% ] 14.48% | 27,569 | 2.2% |
[ 17.5% - 18.0% ] 17.87% | 38,898 | 6.4% |
[ 21.5% - 22.0% ] 21.74% | 56,696 | 12.3% |
[ 26.0% - 26.5% ] 26.46% | 650 | 5.9% |