Brazilian Self-Care Disability
COMPARE
Brazilian
Select to Compare
Self-Care Disability
Brazilian Self-Care Disability
2.3%
SELF-CARE DISABILITY
99.3/ 100
METRIC RATING
65th/ 347
METRIC RANK
Brazilian Self-Care Disability Correlation Chart
The statistical analysis conducted on geographies consisting of 323,606,660 people shows a weak positive correlation between the proportion of Brazilians and percentage of population with self-care disability in the United States with a correlation coefficient (R) of 0.273 and weighted average of 2.3%. On average, for every 1% (one percent) increase in Brazilians within a typical geography, there is an increase of 0.047% in percentage of population with self-care disability.
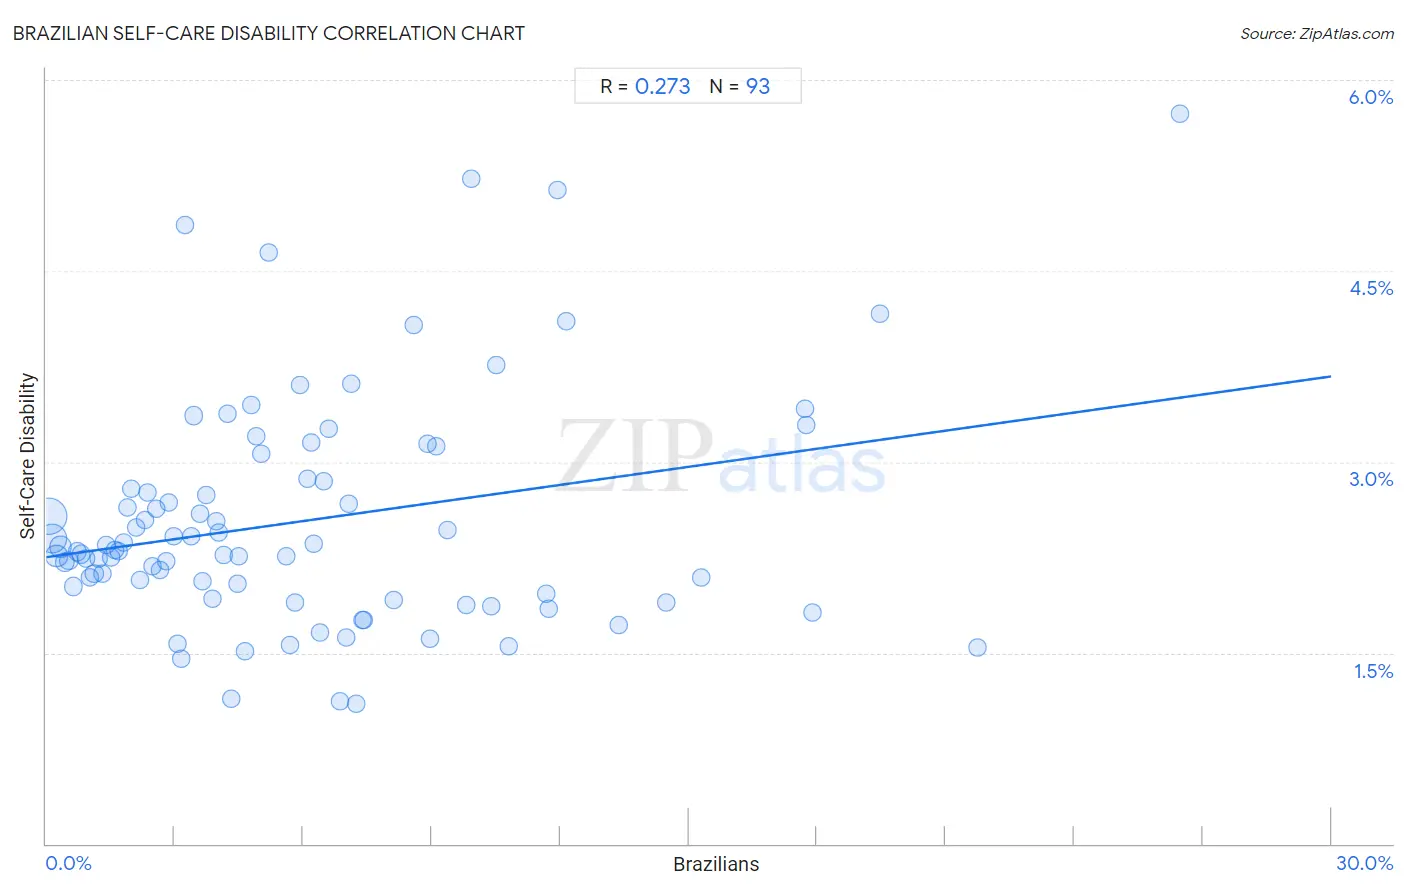
It is essential to understand that the correlation between the percentage of Brazilians and percentage of population with self-care disability does not imply a direct cause-and-effect relationship. It remains uncertain whether the presence of Brazilians influences an upward or downward trend in the level of percentage of population with self-care disability within an area, or if Brazilians simply ended up residing in those areas with higher or lower levels of percentage of population with self-care disability due to other factors.
Demographics Similar to Brazilians by Self-Care Disability
In terms of self-care disability, the demographic groups most similar to Brazilians are Immigrants from Argentina (2.3%, a difference of 0.030%), Swedish (2.3%, a difference of 0.060%), South African (2.3%, a difference of 0.060%), Mongolian (2.3%, a difference of 0.070%), and Immigrants from Zaire (2.3%, a difference of 0.15%).
| Demographics | Rating | Rank | Self-Care Disability |
| Immigrants from Cameroon | 99.6 /100 | #58 | Exceptional 2.3% |
| New Zealanders | 99.5 /100 | #59 | Exceptional 2.3% |
| Immigrants from Japan | 99.5 /100 | #60 | Exceptional 2.3% |
| Palestinians | 99.4 /100 | #61 | Exceptional 2.3% |
| Egyptians | 99.4 /100 | #62 | Exceptional 2.3% |
| Mongolians | 99.3 /100 | #63 | Exceptional 2.3% |
| Swedes | 99.3 /100 | #64 | Exceptional 2.3% |
| Brazilians | 99.3 /100 | #65 | Exceptional 2.3% |
| Immigrants from Argentina | 99.3 /100 | #66 | Exceptional 2.3% |
| South Africans | 99.3 /100 | #67 | Exceptional 2.3% |
| Immigrants from Zaire | 99.2 /100 | #68 | Exceptional 2.3% |
| Immigrants from Norway | 99.2 /100 | #69 | Exceptional 2.3% |
| Immigrants from Northern Europe | 99.2 /100 | #70 | Exceptional 2.3% |
| Asians | 99.2 /100 | #71 | Exceptional 2.3% |
| Eastern Europeans | 99.2 /100 | #72 | Exceptional 2.3% |
Brazilian Self-Care Disability Correlation Summary
| Measurement | Brazilian Data | Self-Care Disability Data |
| Minimum | 0.046% | 1.1% |
| Maximum | 26.5% | 5.7% |
| Range | 26.4% | 4.6% |
| Mean | 6.0% | 2.5% |
| Median | 4.5% | 2.3% |
| Interquartile 25% (IQ1) | 2.2% | 1.9% |
| Interquartile 75% (IQ3) | 8.3% | 2.9% |
| Interquartile Range (IQR) | 6.1% | 0.91% |
| Standard Deviation (Sample) | 5.2% | 0.90% |
| Standard Deviation (Population) | 5.2% | 0.90% |
Correlation Details
| Brazilian Percentile | Sample Size | Self-Care Disability |
[ 0.0% - 0.5% ] 0.046% | 136,973,642 | 2.6% |
[ 0.0% - 0.5% ] 0.14% | 85,362,864 | 2.4% |
[ 0.0% - 0.5% ] 0.24% | 31,685,200 | 2.3% |
[ 0.0% - 0.5% ] 0.33% | 19,788,701 | 2.3% |
[ 0.0% - 0.5% ] 0.43% | 12,156,522 | 2.2% |
[ 0.5% - 1.0% ] 0.53% | 7,574,351 | 2.2% |
[ 0.5% - 1.0% ] 0.63% | 5,704,935 | 2.0% |
[ 0.5% - 1.0% ] 0.73% | 2,606,491 | 2.3% |
[ 0.5% - 1.0% ] 0.81% | 3,071,743 | 2.3% |
[ 0.5% - 1.0% ] 0.92% | 2,544,456 | 2.2% |
[ 1.0% - 1.5% ] 1.02% | 2,019,899 | 2.1% |
[ 1.0% - 1.5% ] 1.12% | 1,606,005 | 2.1% |
[ 1.0% - 1.5% ] 1.21% | 1,432,139 | 2.2% |
[ 1.0% - 1.5% ] 1.31% | 958,050 | 2.1% |
[ 1.0% - 1.5% ] 1.41% | 819,150 | 2.3% |
[ 1.5% - 2.0% ] 1.50% | 798,830 | 2.2% |
[ 1.5% - 2.0% ] 1.60% | 581,737 | 2.3% |
[ 1.5% - 2.0% ] 1.69% | 1,005,343 | 2.3% |
[ 1.5% - 2.0% ] 1.80% | 255,665 | 2.4% |
[ 1.5% - 2.0% ] 1.90% | 486,593 | 2.6% |
[ 1.5% - 2.0% ] 1.97% | 150,919 | 2.8% |
[ 2.0% - 2.5% ] 2.11% | 727,977 | 2.5% |
[ 2.0% - 2.5% ] 2.18% | 440,427 | 2.1% |
[ 2.0% - 2.5% ] 2.30% | 368,846 | 2.5% |
[ 2.0% - 2.5% ] 2.37% | 294,618 | 2.8% |
[ 2.0% - 2.5% ] 2.47% | 143,659 | 2.2% |
[ 2.5% - 3.0% ] 2.56% | 198,034 | 2.6% |
[ 2.5% - 3.0% ] 2.67% | 121,415 | 2.2% |
[ 2.5% - 3.0% ] 2.79% | 60,644 | 2.2% |
[ 2.5% - 3.0% ] 2.87% | 166,142 | 2.7% |
[ 2.5% - 3.0% ] 2.98% | 182,701 | 2.4% |
[ 3.0% - 3.5% ] 3.06% | 63,227 | 1.6% |
[ 3.0% - 3.5% ] 3.16% | 61,562 | 1.5% |
[ 3.0% - 3.5% ] 3.25% | 154 | 4.9% |
[ 3.0% - 3.5% ] 3.37% | 107,271 | 2.4% |
[ 3.0% - 3.5% ] 3.45% | 240,705 | 3.4% |
[ 3.5% - 4.0% ] 3.58% | 255,318 | 2.6% |
[ 3.5% - 4.0% ] 3.65% | 142,758 | 2.1% |
[ 3.5% - 4.0% ] 3.74% | 172,367 | 2.7% |
[ 3.5% - 4.0% ] 3.87% | 32,655 | 1.9% |
[ 3.5% - 4.0% ] 3.96% | 97,412 | 2.5% |
[ 4.0% - 4.5% ] 4.03% | 151,720 | 2.4% |
[ 4.0% - 4.5% ] 4.13% | 29,781 | 2.3% |
[ 4.0% - 4.5% ] 4.25% | 7,419 | 3.4% |
[ 4.0% - 4.5% ] 4.32% | 63,170 | 1.1% |
[ 4.0% - 4.5% ] 4.47% | 42,045 | 2.0% |
[ 4.0% - 4.5% ] 4.50% | 122,618 | 2.3% |
[ 4.5% - 5.0% ] 4.64% | 12,532 | 1.5% |
[ 4.5% - 5.0% ] 4.79% | 321,508 | 3.4% |
[ 4.5% - 5.0% ] 4.90% | 9,246 | 3.2% |
[ 5.0% - 5.5% ] 5.02% | 5,799 | 3.1% |
[ 5.0% - 5.5% ] 5.18% | 29,576 | 4.6% |
[ 5.5% - 6.0% ] 5.61% | 144,030 | 2.3% |
[ 5.5% - 6.0% ] 5.70% | 20,668 | 1.6% |
[ 5.5% - 6.0% ] 5.81% | 3,957 | 1.9% |
[ 5.5% - 6.0% ] 5.93% | 1,012 | 3.6% |
[ 6.0% - 6.5% ] 6.09% | 10,623 | 2.9% |
[ 6.0% - 6.5% ] 6.20% | 742 | 3.1% |
[ 6.0% - 6.5% ] 6.25% | 9,051 | 2.4% |
[ 6.0% - 6.5% ] 6.40% | 5,003 | 1.7% |
[ 6.0% - 6.5% ] 6.48% | 48,922 | 2.8% |
[ 6.5% - 7.0% ] 6.59% | 57,900 | 3.3% |
[ 6.5% - 7.0% ] 6.85% | 70,451 | 1.1% |
[ 6.5% - 7.0% ] 7.00% | 46,938 | 1.6% |
[ 7.0% - 7.5% ] 7.07% | 948 | 2.7% |
[ 7.0% - 7.5% ] 7.12% | 2,330 | 3.6% |
[ 7.0% - 7.5% ] 7.25% | 33,691 | 1.1% |
[ 7.0% - 7.5% ] 7.37% | 17,870 | 1.8% |
[ 7.0% - 7.5% ] 7.42% | 58,644 | 1.8% |
[ 8.0% - 8.5% ] 8.10% | 51,318 | 1.9% |
[ 8.5% - 9.0% ] 8.59% | 32,076 | 4.1% |
[ 8.5% - 9.0% ] 8.89% | 118,546 | 3.1% |
[ 8.5% - 9.0% ] 8.96% | 31,932 | 1.6% |
[ 9.0% - 9.5% ] 9.09% | 253 | 3.1% |
[ 9.0% - 9.5% ] 9.37% | 98,856 | 2.5% |
[ 9.5% - 10.0% ] 9.81% | 11,653 | 1.9% |
[ 9.5% - 10.0% ] 9.91% | 13,154 | 5.2% |
[ 10.0% - 10.5% ] 10.38% | 60,009 | 1.9% |
[ 10.5% - 11.0% ] 10.51% | 1,580 | 3.8% |
[ 10.5% - 11.0% ] 10.79% | 82,782 | 1.6% |
[ 11.5% - 12.0% ] 11.68% | 50,112 | 2.0% |
[ 11.5% - 12.0% ] 11.74% | 71,805 | 1.8% |
[ 11.5% - 12.0% ] 11.93% | 3,589 | 5.1% |
[ 12.0% - 12.5% ] 12.14% | 17,178 | 4.1% |
[ 13.0% - 13.5% ] 13.38% | 30,411 | 1.7% |
[ 14.0% - 14.5% ] 14.48% | 27,569 | 1.9% |
[ 15.0% - 15.5% ] 15.29% | 8,547 | 2.1% |
[ 17.5% - 18.0% ] 17.72% | 1,016 | 3.4% |
[ 17.5% - 18.0% ] 17.75% | 1,183 | 3.3% |
[ 17.5% - 18.0% ] 17.87% | 38,898 | 1.8% |
[ 19.0% - 19.5% ] 19.48% | 2,367 | 4.2% |
[ 21.5% - 22.0% ] 21.74% | 61,855 | 1.5% |
[ 26.0% - 26.5% ] 26.46% | 650 | 5.7% |