Brazilian Disability Age Under 5
COMPARE
Brazilian
Select to Compare
Disability Age Under 5
Brazilian Disability Age Under 5
1.5%
DISABILITY | AGE UNDER 5
0.0/ 100
METRIC RATING
275th/ 347
METRIC RANK
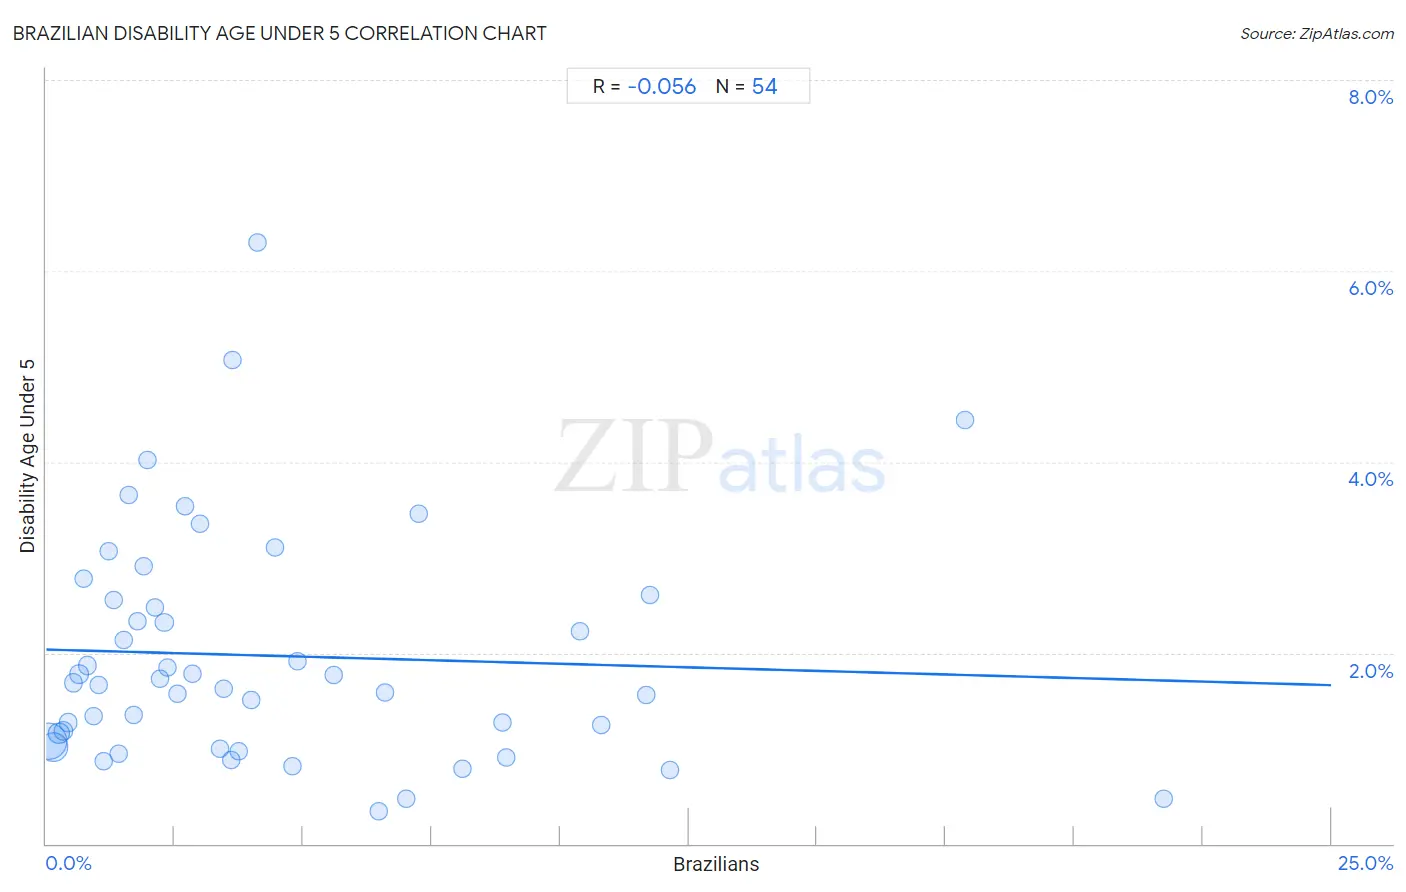
Brazilian Disability Age Under 5 Correlation Chart
The statistical analysis conducted on geographies consisting of 185,712,155 people shows a slight negative correlation between the proportion of Brazilians and percentage of population with a disability under the age of 5 in the United States with a correlation coefficient (R) of -0.056 and weighted average of 1.5%. On average, for every 1% (one percent) increase in Brazilians within a typical geography, there is a decrease of 0.015% in percentage of population with a disability under the age of 5.
It is essential to understand that the correlation between the percentage of Brazilians and percentage of population with a disability under the age of 5 does not imply a direct cause-and-effect relationship. It remains uncertain whether the presence of Brazilians influences an upward or downward trend in the level of percentage of population with a disability under the age of 5 within an area, or if Brazilians simply ended up residing in those areas with higher or lower levels of percentage of population with a disability under the age of 5 due to other factors.
Demographics Similar to Brazilians by Disability Age Under 5
In terms of disability age under 5, the demographic groups most similar to Brazilians are Iroquois (1.5%, a difference of 0.11%), Alaskan Athabascan (1.5%, a difference of 0.38%), Greek (1.5%, a difference of 0.57%), Black/African American (1.4%, a difference of 0.67%), and Immigrants from Canada (1.4%, a difference of 0.83%).
| Demographics | Rating | Rank | Disability Age Under 5 |
| Belgians | 0.1 /100 | #268 | Tragic 1.4% |
| Austrians | 0.1 /100 | #269 | Tragic 1.4% |
| Immigrants from North America | 0.1 /100 | #270 | Tragic 1.4% |
| Immigrants from Canada | 0.1 /100 | #271 | Tragic 1.4% |
| Blacks/African Americans | 0.1 /100 | #272 | Tragic 1.4% |
| Alaskan Athabascans | 0.1 /100 | #273 | Tragic 1.5% |
| Iroquois | 0.0 /100 | #274 | Tragic 1.5% |
| Brazilians | 0.0 /100 | #275 | Tragic 1.5% |
| Greeks | 0.0 /100 | #276 | Tragic 1.5% |
| Canadians | 0.0 /100 | #277 | Tragic 1.5% |
| Kiowa | 0.0 /100 | #278 | Tragic 1.5% |
| Danes | 0.0 /100 | #279 | Tragic 1.5% |
| British | 0.0 /100 | #280 | Tragic 1.5% |
| Czechoslovakians | 0.0 /100 | #281 | Tragic 1.5% |
| Cheyenne | 0.0 /100 | #282 | Tragic 1.5% |
Brazilian Disability Age Under 5 Correlation Summary
| Measurement | Brazilian Data | Disability Age Under 5 Data |
| Minimum | 0.044% | 0.34% |
| Maximum | 21.7% | 6.3% |
| Range | 21.7% | 6.0% |
| Mean | 4.4% | 2.0% |
| Median | 2.8% | 1.7% |
| Interquartile 25% (IQ1) | 1.3% | 1.1% |
| Interquartile 75% (IQ3) | 6.5% | 2.5% |
| Interquartile Range (IQR) | 5.2% | 1.5% |
| Standard Deviation (Sample) | 4.5% | 1.2% |
| Standard Deviation (Population) | 4.5% | 1.2% |
Correlation Details
| Brazilian Percentile | Sample Size | Disability Age Under 5 |
[ 0.0% - 0.5% ] 0.044% | 85,863,793 | 1.1% |
[ 0.0% - 0.5% ] 0.13% | 55,117,019 | 1.0% |
[ 0.0% - 0.5% ] 0.24% | 16,022,523 | 1.2% |
[ 0.0% - 0.5% ] 0.33% | 9,113,158 | 1.2% |
[ 0.0% - 0.5% ] 0.43% | 5,080,032 | 1.3% |
[ 0.5% - 1.0% ] 0.53% | 2,819,632 | 1.7% |
[ 0.5% - 1.0% ] 0.64% | 2,150,841 | 1.8% |
[ 0.5% - 1.0% ] 0.72% | 835,190 | 2.8% |
[ 0.5% - 1.0% ] 0.80% | 1,204,305 | 1.9% |
[ 0.5% - 1.0% ] 0.92% | 1,162,473 | 1.3% |
[ 1.0% - 1.5% ] 1.02% | 458,911 | 1.7% |
[ 1.0% - 1.5% ] 1.12% | 587,906 | 0.87% |
[ 1.0% - 1.5% ] 1.22% | 433,109 | 3.1% |
[ 1.0% - 1.5% ] 1.30% | 232,189 | 2.5% |
[ 1.0% - 1.5% ] 1.41% | 387,178 | 0.95% |
[ 1.5% - 2.0% ] 1.50% | 274,138 | 2.1% |
[ 1.5% - 2.0% ] 1.61% | 187,971 | 3.6% |
[ 1.5% - 2.0% ] 1.69% | 419,106 | 1.3% |
[ 1.5% - 2.0% ] 1.78% | 36,152 | 2.3% |
[ 1.5% - 2.0% ] 1.90% | 309,974 | 2.9% |
[ 1.5% - 2.0% ] 1.97% | 18,550 | 4.0% |
[ 2.0% - 2.5% ] 2.12% | 583,779 | 2.5% |
[ 2.0% - 2.5% ] 2.20% | 62,960 | 1.7% |
[ 2.0% - 2.5% ] 2.30% | 190,683 | 2.3% |
[ 2.0% - 2.5% ] 2.36% | 151,516 | 1.8% |
[ 2.5% - 3.0% ] 2.55% | 114,737 | 1.6% |
[ 2.5% - 3.0% ] 2.70% | 32,323 | 3.5% |
[ 2.5% - 3.0% ] 2.85% | 70,049 | 1.8% |
[ 2.5% - 3.0% ] 2.98% | 26,807 | 3.4% |
[ 3.0% - 3.5% ] 3.37% | 58,741 | 1.00% |
[ 3.0% - 3.5% ] 3.46% | 207,403 | 1.6% |
[ 3.5% - 4.0% ] 3.59% | 167,104 | 0.88% |
[ 3.5% - 4.0% ] 3.61% | 7,641 | 5.1% |
[ 3.5% - 4.0% ] 3.74% | 111,790 | 0.98% |
[ 3.5% - 4.0% ] 3.98% | 52,697 | 1.5% |
[ 4.0% - 4.5% ] 4.12% | 22,739 | 6.3% |
[ 4.0% - 4.5% ] 4.46% | 6,098 | 3.1% |
[ 4.5% - 5.0% ] 4.79% | 307,355 | 0.82% |
[ 4.5% - 5.0% ] 4.90% | 9,246 | 1.9% |
[ 5.5% - 6.0% ] 5.59% | 57,574 | 1.8% |
[ 6.0% - 6.5% ] 6.48% | 48,922 | 0.34% |
[ 6.5% - 7.0% ] 6.59% | 54,125 | 1.6% |
[ 6.5% - 7.0% ] 7.00% | 46,595 | 0.47% |
[ 7.0% - 7.5% ] 7.25% | 33,691 | 3.5% |
[ 8.0% - 8.5% ] 8.10% | 49,890 | 0.79% |
[ 8.5% - 9.0% ] 8.89% | 118,546 | 1.3% |
[ 8.5% - 9.0% ] 8.96% | 31,932 | 0.90% |
[ 10.0% - 10.5% ] 10.38% | 60,009 | 2.2% |
[ 10.5% - 11.0% ] 10.79% | 82,782 | 1.2% |
[ 11.5% - 12.0% ] 11.68% | 45,694 | 1.6% |
[ 11.5% - 12.0% ] 11.74% | 71,805 | 2.6% |
[ 12.0% - 12.5% ] 12.14% | 17,178 | 0.77% |
[ 17.5% - 18.0% ] 17.87% | 38,898 | 4.4% |
[ 21.5% - 22.0% ] 21.74% | 56,696 | 0.48% |