Brazilian Unemployment Among Women with Children Ages 6 to 17 years
COMPARE
Brazilian
Select to Compare
Unemployment Among Women with Children Ages 6 to 17 years
Brazilian Unemployment Among Women with Children Ages 6 to 17 years
9.1%
UNEMPLOYMENT | WOMEN W/ CHILDREN 6 TO 17
24.4/ 100
METRIC RATING
196th/ 347
METRIC RANK
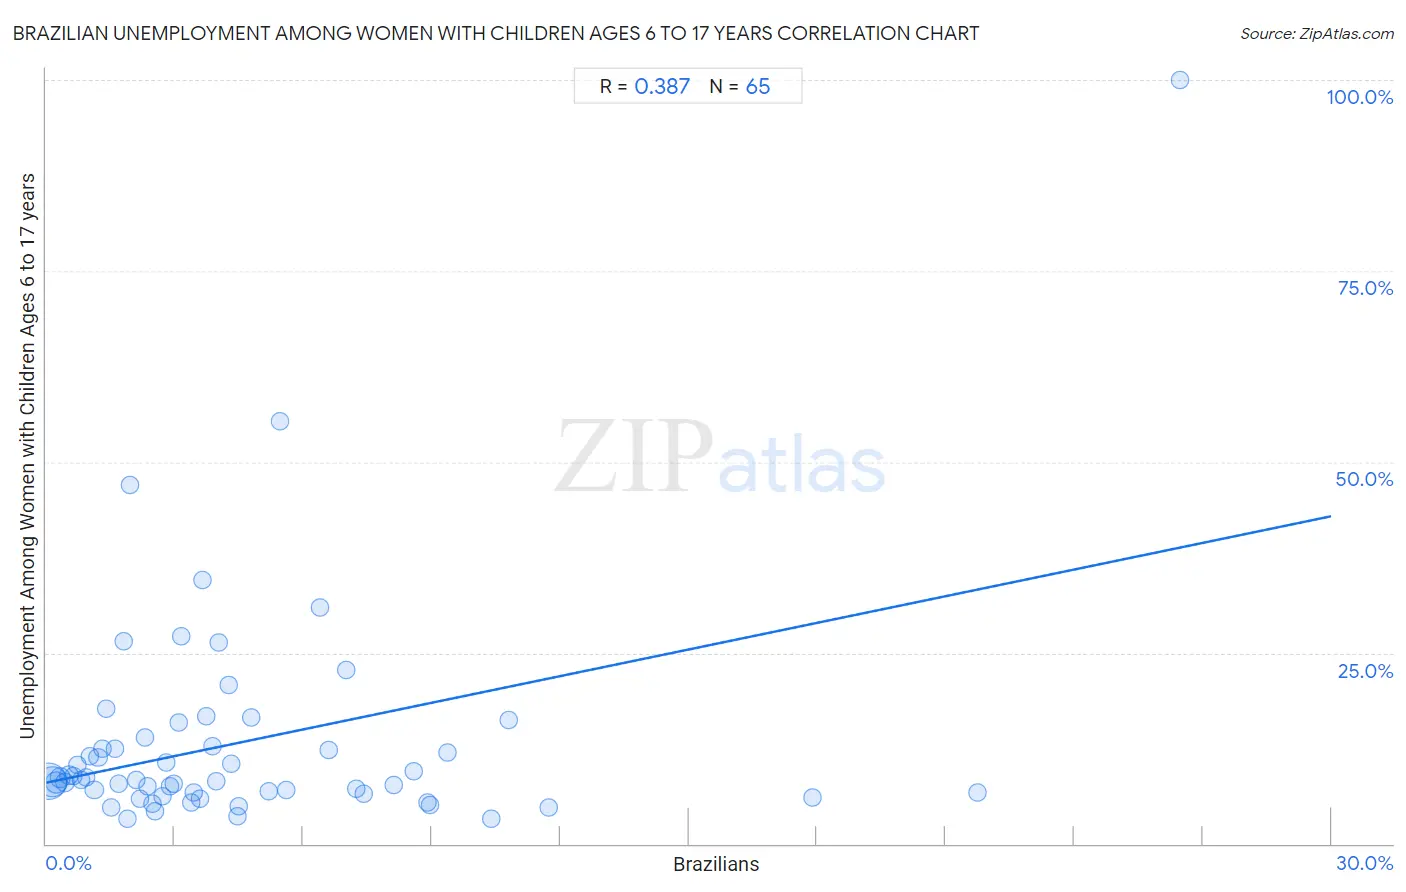
Brazilian Unemployment Among Women with Children Ages 6 to 17 years Correlation Chart
The statistical analysis conducted on geographies consisting of 240,779,171 people shows a mild positive correlation between the proportion of Brazilians and unemployment rate among women with children between the ages 6 and 17 in the United States with a correlation coefficient (R) of 0.387 and weighted average of 9.1%. On average, for every 1% (one percent) increase in Brazilians within a typical geography, there is an increase of 1.2% in unemployment rate among women with children between the ages 6 and 17.
It is essential to understand that the correlation between the percentage of Brazilians and unemployment rate among women with children between the ages 6 and 17 does not imply a direct cause-and-effect relationship. It remains uncertain whether the presence of Brazilians influences an upward or downward trend in the level of unemployment rate among women with children between the ages 6 and 17 within an area, or if Brazilians simply ended up residing in those areas with higher or lower levels of unemployment rate among women with children between the ages 6 and 17 due to other factors.
Demographics Similar to Brazilians by Unemployment Among Women with Children Ages 6 to 17 years
In terms of unemployment among women with children ages 6 to 17 years, the demographic groups most similar to Brazilians are Immigrants from Panama (9.1%, a difference of 0.010%), Austrian (9.1%, a difference of 0.030%), Immigrants from Kazakhstan (9.1%, a difference of 0.050%), Immigrants from Turkey (9.1%, a difference of 0.080%), and Guamanian/Chamorro (9.1%, a difference of 0.16%).
| Demographics | Rating | Rank | Unemployment Among Women with Children Ages 6 to 17 years |
| Immigrants | 29.2 /100 | #189 | Fair 9.1% |
| Slovenes | 28.5 /100 | #190 | Fair 9.1% |
| Belizeans | 28.4 /100 | #191 | Fair 9.1% |
| Guamanians/Chamorros | 27.2 /100 | #192 | Fair 9.1% |
| Immigrants from Turkey | 25.8 /100 | #193 | Fair 9.1% |
| Immigrants from Kazakhstan | 25.3 /100 | #194 | Fair 9.1% |
| Austrians | 25.0 /100 | #195 | Fair 9.1% |
| Brazilians | 24.4 /100 | #196 | Fair 9.1% |
| Immigrants from Panama | 24.3 /100 | #197 | Fair 9.1% |
| Guyanese | 21.8 /100 | #198 | Fair 9.1% |
| Czechoslovakians | 20.8 /100 | #199 | Fair 9.1% |
| Trinidadians and Tobagonians | 18.2 /100 | #200 | Poor 9.1% |
| Immigrants from Trinidad and Tobago | 16.7 /100 | #201 | Poor 9.1% |
| Immigrants from Middle Africa | 15.6 /100 | #202 | Poor 9.1% |
| Maltese | 15.3 /100 | #203 | Poor 9.1% |
Brazilian Unemployment Among Women with Children Ages 6 to 17 years Correlation Summary
| Measurement | Brazilian Data | Unemployment Among Women with Children Ages 6 to 17 years Data |
| Minimum | 0.045% | 3.3% |
| Maximum | 26.5% | 100.0% |
| Range | 26.4% | 96.7% |
| Mean | 4.6% | 13.3% |
| Median | 3.2% | 8.4% |
| Interquartile 25% (IQ1) | 1.6% | 6.7% |
| Interquartile 75% (IQ3) | 6.0% | 13.3% |
| Interquartile Range (IQR) | 4.4% | 6.7% |
| Standard Deviation (Sample) | 4.9% | 14.7% |
| Standard Deviation (Population) | 4.8% | 14.5% |
Correlation Details
| Brazilian Percentile | Sample Size | Unemployment Among Women with Children Ages 6 to 17 years |
[ 0.0% - 0.5% ] 0.045% | 109,508,347 | 8.2% |
[ 0.0% - 0.5% ] 0.14% | 67,096,678 | 8.1% |
[ 0.0% - 0.5% ] 0.24% | 21,717,352 | 8.1% |
[ 0.0% - 0.5% ] 0.33% | 11,989,687 | 8.6% |
[ 0.0% - 0.5% ] 0.43% | 7,736,802 | 8.0% |
[ 0.5% - 1.0% ] 0.53% | 4,589,997 | 9.0% |
[ 0.5% - 1.0% ] 0.63% | 3,309,993 | 8.9% |
[ 0.5% - 1.0% ] 0.72% | 1,409,861 | 10.4% |
[ 0.5% - 1.0% ] 0.81% | 1,906,999 | 8.4% |
[ 0.5% - 1.0% ] 0.92% | 1,567,841 | 8.6% |
[ 1.0% - 1.5% ] 1.02% | 1,094,095 | 11.5% |
[ 1.0% - 1.5% ] 1.12% | 1,004,897 | 7.1% |
[ 1.0% - 1.5% ] 1.21% | 747,193 | 11.4% |
[ 1.0% - 1.5% ] 1.32% | 461,576 | 12.4% |
[ 1.0% - 1.5% ] 1.41% | 504,154 | 17.7% |
[ 1.5% - 2.0% ] 1.51% | 603,789 | 4.8% |
[ 1.5% - 2.0% ] 1.60% | 332,144 | 12.4% |
[ 1.5% - 2.0% ] 1.69% | 733,026 | 7.9% |
[ 1.5% - 2.0% ] 1.80% | 149,445 | 26.5% |
[ 1.5% - 2.0% ] 1.90% | 293,690 | 3.3% |
[ 1.5% - 2.0% ] 1.95% | 16,752 | 46.9% |
[ 2.0% - 2.5% ] 2.11% | 464,324 | 8.4% |
[ 2.0% - 2.5% ] 2.18% | 253,868 | 5.9% |
[ 2.0% - 2.5% ] 2.29% | 260,885 | 14.0% |
[ 2.0% - 2.5% ] 2.36% | 155,986 | 7.6% |
[ 2.0% - 2.5% ] 2.48% | 58,346 | 5.3% |
[ 2.5% - 3.0% ] 2.55% | 133,112 | 4.2% |
[ 2.5% - 3.0% ] 2.70% | 32,323 | 6.2% |
[ 2.5% - 3.0% ] 2.82% | 32,255 | 10.6% |
[ 2.5% - 3.0% ] 2.88% | 66,536 | 7.5% |
[ 2.5% - 3.0% ] 2.99% | 107,617 | 7.8% |
[ 3.0% - 3.5% ] 3.09% | 6,408 | 15.9% |
[ 3.0% - 3.5% ] 3.15% | 41,310 | 27.1% |
[ 3.0% - 3.5% ] 3.37% | 95,663 | 5.5% |
[ 3.0% - 3.5% ] 3.46% | 151,288 | 6.8% |
[ 3.5% - 4.0% ] 3.58% | 235,383 | 5.9% |
[ 3.5% - 4.0% ] 3.65% | 19,926 | 34.6% |
[ 3.5% - 4.0% ] 3.74% | 151,981 | 16.7% |
[ 3.5% - 4.0% ] 3.87% | 27,826 | 12.7% |
[ 3.5% - 4.0% ] 3.96% | 65,597 | 8.3% |
[ 4.0% - 4.5% ] 4.03% | 130,926 | 26.4% |
[ 4.0% - 4.5% ] 4.25% | 6,186 | 20.8% |
[ 4.0% - 4.5% ] 4.32% | 45,914 | 10.5% |
[ 4.0% - 4.5% ] 4.48% | 32,973 | 3.6% |
[ 4.0% - 4.5% ] 4.50% | 110,310 | 4.9% |
[ 4.5% - 5.0% ] 4.79% | 307,355 | 16.5% |
[ 5.0% - 5.5% ] 5.18% | 29,576 | 6.9% |
[ 5.0% - 5.5% ] 5.46% | 1,924 | 55.4% |
[ 5.5% - 6.0% ] 5.61% | 144,030 | 7.1% |
[ 6.0% - 6.5% ] 6.40% | 5,003 | 31.0% |
[ 6.5% - 7.0% ] 6.59% | 54,125 | 12.3% |
[ 6.5% - 7.0% ] 7.00% | 46,595 | 22.7% |
[ 7.0% - 7.5% ] 7.25% | 33,691 | 7.2% |
[ 7.0% - 7.5% ] 7.43% | 54,957 | 6.6% |
[ 8.0% - 8.5% ] 8.10% | 49,890 | 7.7% |
[ 8.5% - 9.0% ] 8.59% | 32,076 | 9.5% |
[ 8.5% - 9.0% ] 8.89% | 118,546 | 5.4% |
[ 8.5% - 9.0% ] 8.96% | 31,932 | 5.0% |
[ 9.0% - 9.5% ] 9.37% | 97,370 | 12.0% |
[ 10.0% - 10.5% ] 10.38% | 60,009 | 3.3% |
[ 10.5% - 11.0% ] 10.79% | 82,782 | 16.2% |
[ 11.5% - 12.0% ] 11.74% | 71,805 | 4.8% |
[ 17.5% - 18.0% ] 17.87% | 38,898 | 6.0% |
[ 21.5% - 22.0% ] 21.74% | 56,696 | 6.7% |
[ 26.0% - 26.5% ] 26.46% | 650 | 100.0% |