Welsh 4 or more Vehicles in Household

COMPARE

Welsh
Race
Ancestry
AfghanAfricanAlaska NativeAlaskan AthabascanAlbanianAleutAlsatianAmericanApacheArabArapahoArgentineanArmenianAssyrian/Chaldean/SyriacAustralianAustrianBahamianBangladeshiBarbadianBasqueBelgianBelizeanBermudanBhutaneseBlackfeetBolivianBrazilianBritishBritish West IndianBulgarianBurmeseCajunCambodianCanadianCape VerdeanCarpatho RusynCelticCentral AmericanCentral American IndianCherokeeCheyenneChickasawChileanChineseChippewaChoctawColombianColvilleComancheCosta RicanCreeCreekCroatianCrowCubanCypriotCzechCzechoslovakianDanishDelawareDominicanDutchDutch West IndianEastern EuropeanEcuadorianEgyptianEnglishEstonianEthiopianEuropeanFijianFilipinoFinnishFrenchFrench American IndianFrench CanadianGermanGerman RussianGhanaianGreekGuamanian/ChamorroGuatemalanGuyaneseHaitianHmongHonduranHopiHoumaHungarianIcelanderIndian (Asian)IndonesianInupiatIranianIraqiIrishIroquoisIsraeliItalianJamaicanJapaneseJordanianKenyanKiowaKoreanLaotianLatvianLebaneseLiberianLithuanianLumbeeLuxembourgerMacedonianMalaysianMalteseMarshalleseMenomineeMexicanMexican American IndianMongolianMoroccanNative HawaiianNavajoNepaleseNew ZealanderNicaraguanNigerianNorthern EuropeanNorwegianOkinawanOsageOttawaPaiutePakistaniPalestinianPanamanianParaguayanPennsylvania GermanPeruvianPimaPolishPortuguesePotawatomiPuebloPuerto RicanPuget Sound SalishRomanianRussianSalvadoranSamoanScandinavianScotch-IrishScottishSeminoleSenegaleseSerbianShoshoneSierra LeoneanSiouxSlavicSlovakSloveneSomaliSouth AfricanSouth AmericanSouth American IndianSoviet UnionSpaniardSpanishSpanish AmericanSpanish American IndianSri LankanSubsaharan AfricanSudaneseSwedishSwissSyrianTaiwaneseThaiTlingit-HaidaTohono O'OdhamTonganTrinidadian and TobagonianTsimshianTurkishU.S. Virgin IslanderUgandanUkrainianUruguayanUteVenezuelanVietnameseWelshWest IndianYakamaYaquiYugoslavianYumanYup'ikZimbabwean
Immigration
NonimmigrantsImmigrantsAfghanistanAfricaAlbaniaArgentinaArmeniaAsiaAustraliaAustriaBahamasBangladeshBarbadosBelarusBelgiumBelizeBoliviaBosnia and HerzegovinaBrazilBulgariaBurma/MyanmarCabo VerdeCambodiaCameroonCanadaCaribbeanCentral AmericaChileChinaColombiaCongoCosta RicaCroatiaCubaCzechoslovakiaDenmarkDominicaDominican RepublicEastern AfricaEastern AsiaEastern EuropeEcuadorEgyptEl SalvadorEnglandEritreaEthiopiaEuropeFijiFranceGermanyGhanaGreeceGrenadaGuatemalaGuyanaHaitiHondurasHong KongHungaryIndiaIndonesiaIranIraqIrelandIsraelItalyJamaicaJapanJordanKazakhstanKenyaKoreaKuwaitLaosLatin AmericaLatviaLebanonLiberiaLithuaniaMalaysiaMexicoMicronesiaMiddle AfricaMoldovaMoroccoNepalNetherlandsNicaraguaNigeriaNorth AmericaNorth MacedoniaNorthern AfricaNorthern EuropeNorwayOceaniaPakistanPanamaPeruPhilippinesPolandPortugalRomaniaRussiaSaudi ArabiaScotlandSenegalSerbiaSierra LeoneSingaporeSomaliaSouth AfricaSouth AmericaSouth Central AsiaSouth Eastern AsiaSouthern EuropeSpainSri LankaSt. Vincent and the GrenadinesSudanSwedenSwitzerlandSyriaTaiwanThailandTrinidad and TobagoTurkeyUgandaUkraineUruguayUzbekistanVenezuelaVietnamWest IndiesWestern AfricaWestern AsiaWestern EuropeYemenZaireZimbabweAzores
Select to Compare
Race
Ancestry
AfghanAfricanAlaska NativeAlaskan AthabascanAlbanianAleutAlsatianAmericanApacheArabArapahoArgentineanArmenianAssyrian/Chaldean/SyriacAustralianAustrianBahamianBangladeshiBarbadianBasqueBelgianBelizeanBermudanBhutaneseBlackfeetBolivianBrazilianBritishBritish West IndianBulgarianBurmeseCajunCambodianCanadianCape VerdeanCarpatho RusynCelticCentral AmericanCentral American IndianCherokeeCheyenneChickasawChileanChineseChippewaChoctawColombianColvilleComancheCosta RicanCreeCreekCroatianCrowCubanCypriotCzechCzechoslovakianDanishDelawareDominicanDutchDutch West IndianEastern EuropeanEcuadorianEgyptianEnglishEstonianEthiopianEuropeanFijianFilipinoFinnishFrenchFrench American IndianFrench CanadianGermanGerman RussianGhanaianGreekGuamanian/ChamorroGuatemalanGuyaneseHaitianHmongHonduranHopiHoumaHungarianIcelanderIndian (Asian)IndonesianInupiatIranianIraqiIrishIroquoisIsraeliItalianJamaicanJapaneseJordanianKenyanKiowaKoreanLaotianLatvianLebaneseLiberianLithuanianLumbeeLuxembourgerMacedonianMalaysianMalteseMarshalleseMenomineeMexicanMexican American IndianMongolianMoroccanNative HawaiianNavajoNepaleseNew ZealanderNicaraguanNigerianNorthern EuropeanNorwegianOkinawanOsageOttawaPaiutePakistaniPalestinianPanamanianParaguayanPennsylvania GermanPeruvianPimaPolishPortuguesePotawatomiPuebloPuerto RicanPuget Sound SalishRomanianRussianSalvadoranSamoanScandinavianScotch-IrishScottishSeminoleSenegaleseSerbianShoshoneSierra LeoneanSiouxSlavicSlovakSloveneSomaliSouth AfricanSouth AmericanSouth American IndianSoviet UnionSpaniardSpanishSpanish AmericanSpanish American IndianSri LankanSubsaharan AfricanSudaneseSwedishSwissSyrianTaiwaneseThaiTlingit-HaidaTohono O'OdhamTonganTrinidadian and TobagonianTsimshianTurkishU.S. Virgin IslanderUgandanUkrainianUruguayanUteVenezuelanVietnameseWest IndianYakamaYaquiYugoslavianYumanYup'ikZimbabwean
Immigration
NonimmigrantsImmigrantsAfghanistanAfricaAlbaniaArgentinaArmeniaAsiaAustraliaAustriaBahamasBangladeshBarbadosBelarusBelgiumBelizeBoliviaBosnia and HerzegovinaBrazilBulgariaBurma/MyanmarCabo VerdeCambodiaCameroonCanadaCaribbeanCentral AmericaChileChinaColombiaCongoCosta RicaCroatiaCubaCzechoslovakiaDenmarkDominicaDominican RepublicEastern AfricaEastern AsiaEastern EuropeEcuadorEgyptEl SalvadorEnglandEritreaEthiopiaEuropeFijiFranceGermanyGhanaGreeceGrenadaGuatemalaGuyanaHaitiHondurasHong KongHungaryIndiaIndonesiaIranIraqIrelandIsraelItalyJamaicaJapanJordanKazakhstanKenyaKoreaKuwaitLaosLatin AmericaLatviaLebanonLiberiaLithuaniaMalaysiaMexicoMicronesiaMiddle AfricaMoldovaMoroccoNepalNetherlandsNicaraguaNigeriaNorth AmericaNorth MacedoniaNorthern AfricaNorthern EuropeNorwayOceaniaPakistanPanamaPeruPhilippinesPolandPortugalRomaniaRussiaSaudi ArabiaScotlandSenegalSerbiaSierra LeoneSingaporeSomaliaSouth AfricaSouth AmericaSouth Central AsiaSouth Eastern AsiaSouthern EuropeSpainSri LankaSt. Vincent and the GrenadinesSudanSwedenSwitzerlandSyriaTaiwanThailandTrinidad and TobagoTurkeyUgandaUkraineUruguayUzbekistanVenezuelaVietnamWest IndiesWestern AfricaWestern AsiaWestern EuropeYemenZaireZimbabweAzores
4 or more Vehicles in Household
Income
Poverty
Unemployment
Labor Participation
Family Structure
Vehicle Availability
Education Level
Disability

Welsh 4 or more Vehicles in Household
Exceptional

7.5%
4+ VEHICLES AVAILABLE
99.9/ 100
METRIC RATING
68th/ 347
METRIC RANK

Welsh 4 or more Vehicles in Household Correlation Chart

The statistical analysis conducted on geographies consisting of 526,008,670 people shows a strong positive correlation between the proportion of Welsh and percentage of households with 4 or more vehicles available in the United States with a correlation coefficient (R) of 0.788 and weighted average of 7.5%. On average, for every 1% (one percent) increase in Welsh within a typical geography, there is an increase of 1.0% in percentage of households with 4 or more vehicles available.
Welsh 4 or more Vehicles in Household
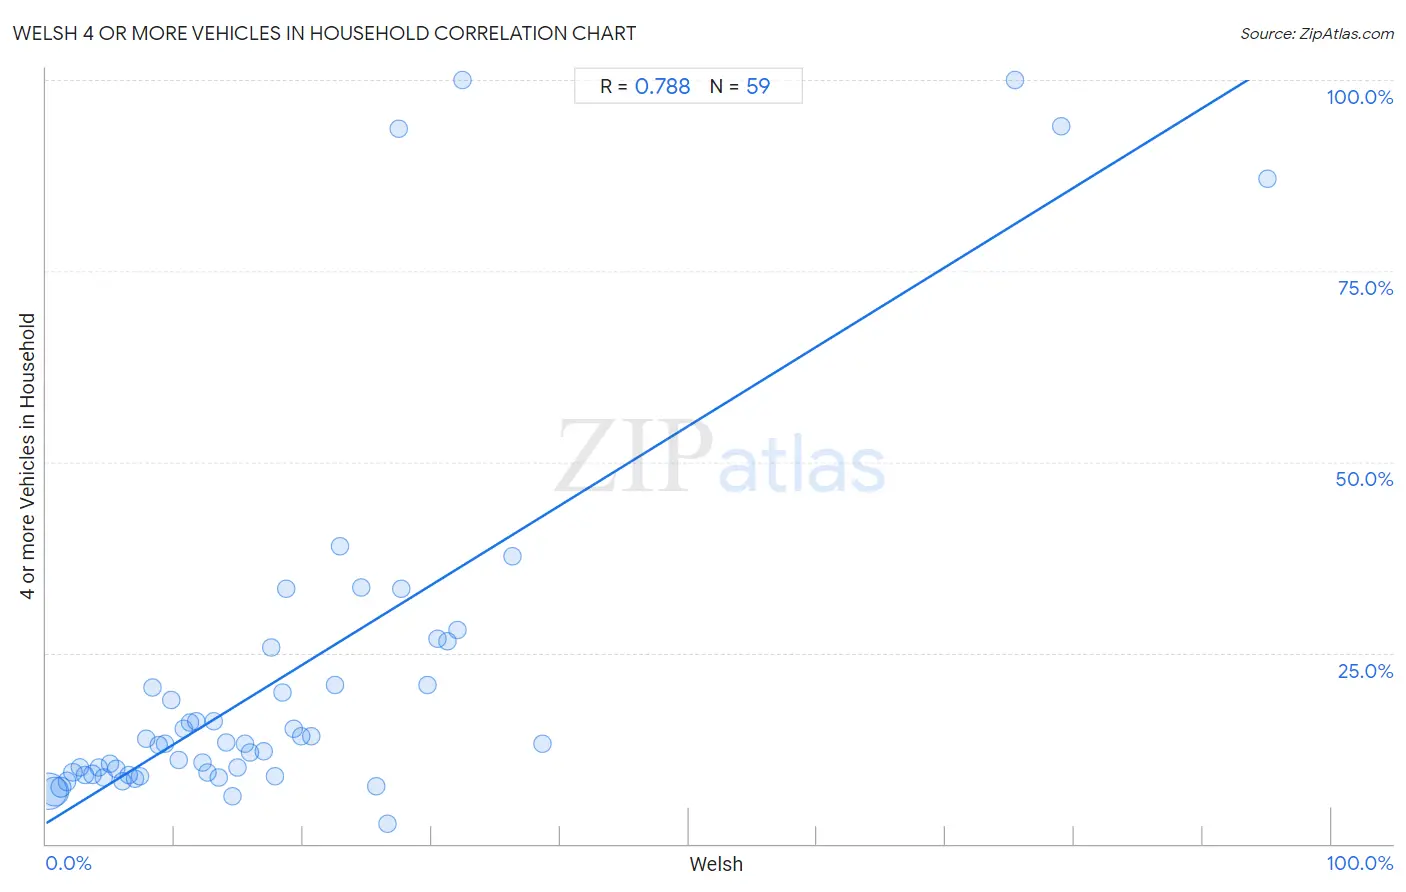
It is essential to understand that the correlation between the percentage of Welsh and percentage of households with 4 or more vehicles available does not imply a direct cause-and-effect relationship. It remains uncertain whether the presence of Welsh influences an upward or downward trend in the level of percentage of households with 4 or more vehicles available within an area, or if Welsh simply ended up residing in those areas with higher or lower levels of percentage of households with 4 or more vehicles available due to other factors.

Demographics Similar to Welsh by 4 or more Vehicles in Household

In terms of 4 or more vehicles in household, the demographic groups most similar to Welsh are American (7.5%, a difference of 0.36%), Immigrants from Taiwan (7.5%, a difference of 0.37%), German (7.5%, a difference of 0.59%), Scottish (7.4%, a difference of 0.67%), and Immigrants from the Azores (7.5%, a difference of 0.70%).
DemographicsRating | Rank4 or more Vehicles in Household
Europeans
100.0
/100
|
#61
Exceptional
7.6%
Chippewa
100.0
/100
|
#62
Exceptional
7.6%
Immigrants from Micronesia
100.0
/100
|
#63
Exceptional
7.6%
Bangladeshis
100.0
/100
|
#64
Exceptional
7.6%
Immigrants from the Azores
100.0
/100
|
#65
Exceptional
7.5%
Immigrants from Taiwan
99.9
/100
|
#66
Exceptional
7.5%
Americans
99.9
/100
|
#67
Exceptional
7.5%
Welsh
99.9
/100
|
#68
Exceptional
7.5%
Germans
99.9
/100
|
#69
Exceptional
7.5%
Scottish
99.9
/100
|
#70
Exceptional
7.4%
Chickasaw
99.9
/100
|
#71
Exceptional
7.4%
Scotch-Irish
99.9
/100
|
#72
Exceptional
7.4%
Portuguese
99.9
/100
|
#73
Exceptional
7.4%
Icelanders
99.9
/100
|
#74
Exceptional
7.4%
Immigrants from Cambodia
99.9
/100
|
#75
Exceptional
7.4%

Welsh 4 or more Vehicles in Household Correlation Summary

MeasurementWelsh Data4 or more Vehicles in Household Data
Minimum0.24%2.6%
Maximum95.0%100.0%
Range94.8%97.4%
Mean18.3%21.8%
Median14.0%13.1%
Interquartile 25% (IQ1)6.9%9.1%
Interquartile 75% (IQ3)24.5%20.8%
Interquartile Range (IQR)17.6%11.8%
Standard Deviation (Sample)18.1%24.0%
Standard Deviation (Population)18.0%23.8%

Correlation Details

Welsh PercentileSample Size4 or more Vehicles in Household
[
0.0%
-
0.5%
]
0.24%
287,158,5636.9%
[
0.5%
-
1.0%
]
0.67%
161,340,1536.9%
[
1.0%
-
1.5%
]
1.13%
47,878,2877.4%
[
1.5%
-
2.0%
]
1.62%
15,753,7528.2%
[
2.0%
-
2.5%
]
2.09%
6,543,5669.4%
[
2.5%
-
3.0%
]
2.59%
3,328,86410.0%
[
3.0%
-
3.5%
]
3.06%
1,320,2829.1%
[
3.5%
-
4.0%
]
3.56%
883,6119.1%
[
4.0%
-
4.5%
]
4.04%
424,23710.0%
[
4.0%
-
4.5%
]
4.49%
279,8868.7%
[
4.5%
-
5.0%
]
4.97%
350,99810.5%
[
5.0%
-
5.5%
]
5.46%
194,2149.9%
[
5.5%
-
6.0%
]
5.92%
105,1648.1%
[
6.0%
-
6.5%
]
6.39%
94,5969.0%
[
6.5%
-
7.0%
]
6.90%
67,2988.5%
[
7.0%
-
7.5%
]
7.33%
52,2878.8%
[
7.5%
-
8.0%
]
7.80%
56,85113.7%
[
8.0%
-
8.5%
]
8.29%
20,72120.5%
[
8.5%
-
9.0%
]
8.75%
20,15713.0%
[
9.0%
-
9.5%
]
9.24%
14,86113.1%
[
9.5%
-
10.0%
]
9.76%
17,95318.9%
[
10.0%
-
10.5%
]
10.29%
10,00711.0%
[
10.5%
-
11.0%
]
10.72%
9,00815.0%
[
11.0%
-
11.5%
]
11.15%
3,99015.9%
[
11.5%
-
12.0%
]
11.63%
13,60716.1%
[
12.0%
-
12.5%
]
12.20%
14,28010.6%
[
12.5%
-
13.0%
]
12.54%
2,8009.3%
[
12.5%
-
13.0%
]
12.99%
2,20116.0%
[
13.0%
-
13.5%
]
13.47%
6,8848.7%
[
13.5%
-
14.0%
]
14.00%
5,13013.2%
[
14.5%
-
15.0%
]
14.54%
7,0836.2%
[
14.5%
-
15.0%
]
14.88%
2,1519.9%
[
15.5%
-
16.0%
]
15.51%
2,25713.1%
[
15.5%
-
16.0%
]
15.87%
1,87211.9%
[
16.5%
-
17.0%
]
16.92%
1,40712.1%
[
17.5%
-
18.0%
]
17.51%
1,05125.8%
[
17.5%
-
18.0%
]
17.83%
1,7728.9%
[
18.0%
-
18.5%
]
18.43%
9,03919.7%
[
18.5%
-
19.0%
]
18.68%
9133.3%
[
19.0%
-
19.5%
]
19.26%
46215.0%
[
19.5%
-
20.0%
]
19.81%
42914.1%
[
20.5%
-
21.0%
]
20.63%
1,27014.0%
[
22.5%
-
23.0%
]
22.52%
3,03320.8%
[
22.5%
-
23.0%
]
22.86%
7038.9%
[
24.5%
-
25.0%
]
24.55%
49733.5%
[
25.5%
-
26.0%
]
25.71%
1057.6%
[
26.5%
-
27.0%
]
26.56%
642.6%
[
27.0%
-
27.5%
]
27.43%
17593.5%
[
27.5%
-
28.0%
]
27.62%
10533.3%
[
29.5%
-
30.0%
]
29.70%
20220.8%
[
30.0%
-
30.5%
]
30.48%
10526.8%
[
31.0%
-
31.5%
]
31.21%
17326.6%
[
32.0%
-
32.5%
]
32.05%
39028.0%
[
32.0%
-
32.5%
]
32.43%
37100.0%
[
36.0%
-
36.5%
]
36.31%
17937.7%
[
38.5%
-
39.0%
]
38.58%
19713.2%
[
75.0%
-
75.5%
]
75.38%
65100.0%
[
79.0%
-
79.5%
]
79.01%
8193.9%
[
95.0%
-
95.5%
]
95.00%
10087.1%