Welsh 3 or more Vehicles in Household
COMPARE
Welsh
Select to Compare
3 or more Vehicles in Household
Welsh 3 or more Vehicles in Household
22.6%
3+ VEHICLES AVAILABLE
100.0/ 100
METRIC RATING
52nd/ 347
METRIC RANK
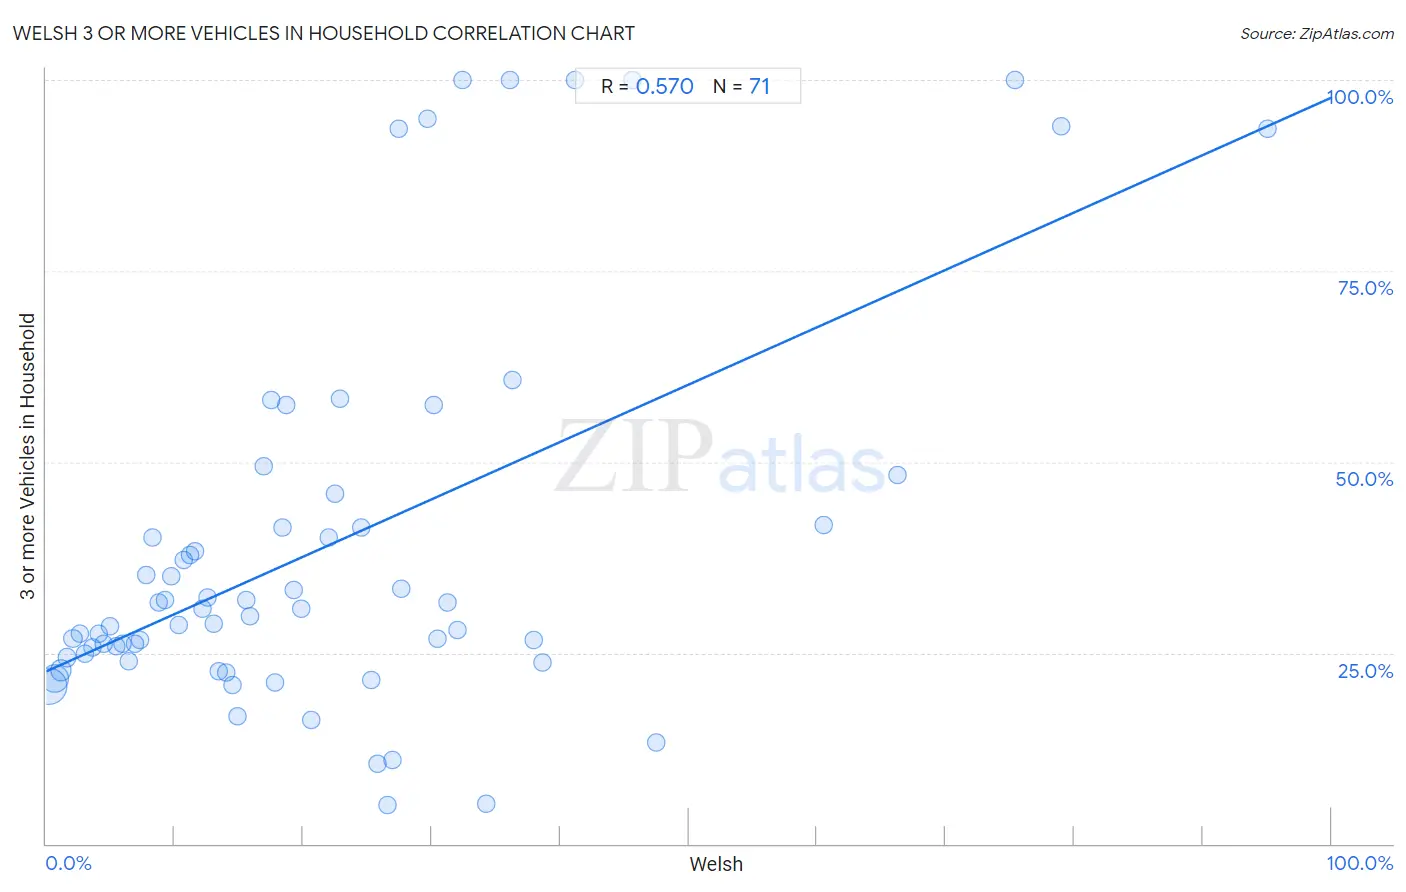
Welsh 3 or more Vehicles in Household Correlation Chart
The statistical analysis conducted on geographies consisting of 528,014,729 people shows a substantial positive correlation between the proportion of Welsh and percentage of households with 3 or more vehicles available in the United States with a correlation coefficient (R) of 0.570 and weighted average of 22.6%. On average, for every 1% (one percent) increase in Welsh within a typical geography, there is an increase of 0.75% in percentage of households with 3 or more vehicles available.
It is essential to understand that the correlation between the percentage of Welsh and percentage of households with 3 or more vehicles available does not imply a direct cause-and-effect relationship. It remains uncertain whether the presence of Welsh influences an upward or downward trend in the level of percentage of households with 3 or more vehicles available within an area, or if Welsh simply ended up residing in those areas with higher or lower levels of percentage of households with 3 or more vehicles available due to other factors.
Demographics Similar to Welsh by 3 or more Vehicles in Household
In terms of 3 or more vehicles in household, the demographic groups most similar to Welsh are White/Caucasian (22.6%, a difference of 0.040%), Sioux (22.6%, a difference of 0.050%), Scotch-Irish (22.6%, a difference of 0.11%), Scottish (22.6%, a difference of 0.21%), and Malaysian (22.6%, a difference of 0.22%).
| Demographics | Rating | Rank | 3 or more Vehicles in Household |
| Ute | 100.0 /100 | #45 | Exceptional 22.7% |
| Americans | 100.0 /100 | #46 | Exceptional 22.6% |
| Malaysians | 100.0 /100 | #47 | Exceptional 22.6% |
| Scottish | 100.0 /100 | #48 | Exceptional 22.6% |
| Scotch-Irish | 100.0 /100 | #49 | Exceptional 22.6% |
| Sioux | 100.0 /100 | #50 | Exceptional 22.6% |
| Whites/Caucasians | 100.0 /100 | #51 | Exceptional 22.6% |
| Welsh | 100.0 /100 | #52 | Exceptional 22.6% |
| Czechs | 100.0 /100 | #53 | Exceptional 22.5% |
| Crow | 100.0 /100 | #54 | Exceptional 22.5% |
| Immigrants from Laos | 100.0 /100 | #55 | Exceptional 22.4% |
| Hispanics or Latinos | 100.0 /100 | #56 | Exceptional 22.4% |
| Pennsylvania Germans | 100.0 /100 | #57 | Exceptional 22.3% |
| Spaniards | 100.0 /100 | #58 | Exceptional 22.3% |
| Navajo | 100.0 /100 | #59 | Exceptional 22.3% |
Welsh 3 or more Vehicles in Household Correlation Summary
| Measurement | Welsh Data | 3 or more Vehicles in Household Data |
| Minimum | 0.24% | 5.1% |
| Maximum | 95.0% | 100.0% |
| Range | 94.8% | 94.9% |
| Mean | 21.9% | 39.0% |
| Median | 17.5% | 30.7% |
| Interquartile 25% (IQ1) | 8.3% | 24.3% |
| Interquartile 75% (IQ3) | 30.1% | 41.7% |
| Interquartile Range (IQR) | 21.8% | 17.3% |
| Standard Deviation (Sample) | 19.1% | 25.2% |
| Standard Deviation (Population) | 19.0% | 25.0% |
Correlation Details
| Welsh Percentile | Sample Size | 3 or more Vehicles in Household |
[ 0.0% - 0.5% ] 0.24% | 288,319,327 | 20.6% |
[ 0.5% - 1.0% ] 0.67% | 161,805,448 | 21.6% |
[ 1.0% - 1.5% ] 1.13% | 48,016,529 | 22.7% |
[ 1.5% - 2.0% ] 1.62% | 15,827,833 | 24.3% |
[ 2.0% - 2.5% ] 2.09% | 6,559,607 | 26.9% |
[ 2.5% - 3.0% ] 2.59% | 3,358,192 | 27.5% |
[ 3.0% - 3.5% ] 3.06% | 1,341,807 | 24.9% |
[ 3.5% - 4.0% ] 3.56% | 900,569 | 25.7% |
[ 4.0% - 4.5% ] 4.04% | 443,644 | 27.5% |
[ 4.0% - 4.5% ] 4.49% | 287,679 | 26.2% |
[ 4.5% - 5.0% ] 4.97% | 362,136 | 28.5% |
[ 5.0% - 5.5% ] 5.46% | 204,636 | 25.8% |
[ 5.5% - 6.0% ] 5.92% | 109,318 | 26.3% |
[ 6.0% - 6.5% ] 6.40% | 98,224 | 23.9% |
[ 6.5% - 7.0% ] 6.90% | 69,421 | 26.2% |
[ 7.0% - 7.5% ] 7.32% | 55,136 | 26.7% |
[ 7.5% - 8.0% ] 7.80% | 60,111 | 35.2% |
[ 8.0% - 8.5% ] 8.29% | 21,606 | 40.1% |
[ 8.5% - 9.0% ] 8.75% | 20,538 | 31.5% |
[ 9.0% - 9.5% ] 9.25% | 16,738 | 31.9% |
[ 9.5% - 10.0% ] 9.75% | 20,812 | 35.0% |
[ 10.0% - 10.5% ] 10.27% | 10,815 | 28.6% |
[ 10.5% - 11.0% ] 10.71% | 10,394 | 37.1% |
[ 11.0% - 11.5% ] 11.19% | 5,193 | 37.8% |
[ 11.5% - 12.0% ] 11.62% | 14,356 | 38.3% |
[ 12.0% - 12.5% ] 12.20% | 14,364 | 30.7% |
[ 12.5% - 13.0% ] 12.54% | 3,580 | 32.2% |
[ 12.5% - 13.0% ] 13.00% | 2,439 | 28.8% |
[ 13.0% - 13.5% ] 13.47% | 7,616 | 22.6% |
[ 13.5% - 14.0% ] 14.00% | 5,359 | 22.4% |
[ 14.5% - 15.0% ] 14.54% | 7,874 | 20.7% |
[ 14.5% - 15.0% ] 14.87% | 2,239 | 16.7% |
[ 15.5% - 16.0% ] 15.52% | 3,311 | 31.8% |
[ 15.5% - 16.0% ] 15.87% | 1,872 | 29.8% |
[ 16.5% - 17.0% ] 16.90% | 1,544 | 49.4% |
[ 17.5% - 18.0% ] 17.50% | 1,097 | 58.1% |
[ 17.5% - 18.0% ] 17.83% | 1,772 | 21.2% |
[ 18.0% - 18.5% ] 18.43% | 9,039 | 41.4% |
[ 18.5% - 19.0% ] 18.68% | 91 | 57.4% |
[ 19.0% - 19.5% ] 19.24% | 577 | 33.3% |
[ 19.5% - 20.0% ] 19.81% | 429 | 30.8% |
[ 20.5% - 21.0% ] 20.62% | 2,119 | 16.2% |
[ 22.0% - 22.5% ] 22.03% | 1,875 | 40.1% |
[ 22.5% - 23.0% ] 22.52% | 3,033 | 45.8% |
[ 22.5% - 23.0% ] 22.86% | 70 | 58.3% |
[ 24.5% - 25.0% ] 24.55% | 497 | 41.4% |
[ 25.0% - 25.5% ] 25.33% | 75 | 21.4% |
[ 25.5% - 26.0% ] 25.76% | 198 | 10.5% |
[ 26.5% - 27.0% ] 26.56% | 64 | 5.1% |
[ 26.5% - 27.0% ] 26.94% | 386 | 10.9% |
[ 27.0% - 27.5% ] 27.43% | 175 | 93.5% |
[ 27.5% - 28.0% ] 27.62% | 105 | 33.3% |
[ 29.5% - 30.0% ] 29.69% | 229 | 94.9% |
[ 30.0% - 30.5% ] 30.12% | 83 | 57.4% |
[ 30.0% - 30.5% ] 30.48% | 105 | 26.8% |
[ 31.0% - 31.5% ] 31.21% | 173 | 31.6% |
[ 32.0% - 32.5% ] 32.05% | 390 | 28.0% |
[ 32.0% - 32.5% ] 32.43% | 37 | 100.0% |
[ 34.0% - 34.5% ] 34.23% | 222 | 5.2% |
[ 36.0% - 36.5% ] 36.05% | 147 | 100.0% |
[ 36.0% - 36.5% ] 36.31% | 179 | 60.8% |
[ 37.5% - 38.0% ] 37.93% | 58 | 26.7% |
[ 38.5% - 39.0% ] 38.58% | 197 | 23.7% |
[ 41.0% - 41.5% ] 41.11% | 90 | 100.0% |
[ 45.5% - 46.0% ] 45.65% | 46 | 100.0% |
[ 47.0% - 47.5% ] 47.47% | 375 | 13.3% |
[ 60.0% - 60.5% ] 60.47% | 43 | 41.7% |
[ 66.0% - 66.5% ] 66.25% | 240 | 48.3% |
[ 75.0% - 75.5% ] 75.38% | 65 | 100.0% |
[ 79.0% - 79.5% ] 79.01% | 81 | 93.9% |
[ 95.0% - 95.5% ] 95.00% | 100 | 93.5% |